Ethereum (CRYPTO:ETH) and Ethereum Classic (CRYPTO:ETC) are two cryptocurrencies running on the Ethereum blockchain.
Ethereum Classic is the old version of Ethereum that executed smart contracts with a Proof-Of-Work platform. Following a hack on the platform, Ethereum worked on the code to switch the execution of smart contracts from Proof-Of-Work to Proof-Of-Stake to avoid another hack in the future.
Below is a technical look at the charts.
See Also: Is Ethereum A Good Investment?
Ethereum Daily Chart Analysis
- Ethereum recently broke out of an ascending triangle pattern, tested old resistance as support, and has since been rallying.
- Ethereum is trading above both the 50-day moving average (green) and the 200-day moving average (blue), indicating the sentiment has been bullish.
- Both of these moving averages may hold as a potential area of support.
Key Levels To Watch
- The ascending triangle broke out when Ethereum crossed the $2,000 mark. This level retested at support and then was able to further rally.
- The crypto showed some resistance near the $3500 level before it crossed above and moved over $4,000.
- When Ethereum cools off it may find support near the $3,600 level again.

Ethereum Classic Daily Chart Analysis
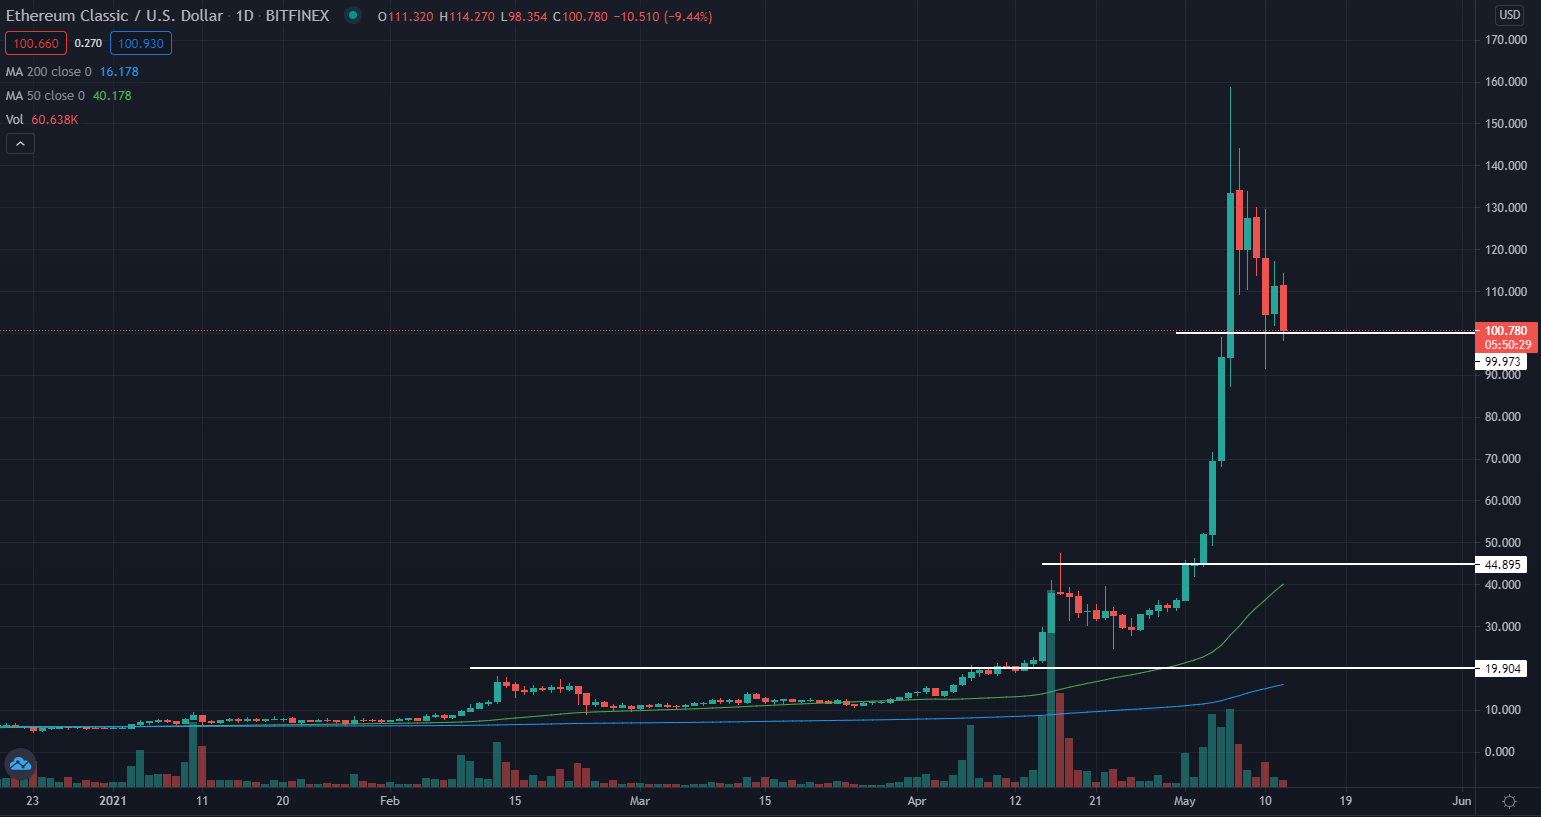
- Ethereum Classic broke out of an old resistance level and saw a large jump into the months of April and May.
- Ethereum Classic is trading above both the 50-day moving average (green) and the 200-day moving average (blue), indicating the sentiment has been bullish.
- Both of these moving averages may hold as a potential area of support.
Key Levels To Watch
- In early May, Ethereum Classic broke out of an old resistance level near $45 and saw a large run up afterward.
- The crypto peaked near $160 before cooling off, support may be found near the $100 level as this was an area it bounced near.
© 2021 Benzinga.com. Benzinga does not provide investment advice. All rights
reserved.
