Ethereum (ETH/USD) and Alt-Coins Price, Analysis and Chart:
- Cryptocurrency rally continues, Ethereum (ETH) leads the way.
- Bitcoin Cash (BCH) surging, back in the spotlight.
- Ripple (XRP) hitting double-digit gains.
Ethereum (ETH), the second-largest cryptocurrency by market cap, continues to print new highs and is up nearly 25% over the last seven days. The latest boost was likely fueled by news that the European Investment Bank (EIB) issued a EUR100 million digital bond on the Ethereum blockchain this week, adding further utility to the network and value to the coin. As this utility grows, Ethereum can break $3,000 and above, although its recent spectacular ascent may need a short period of consolidation before the next leg higher. The Ethereum rally over the last few months can be seen clearly in the one week chart, and just over one-year ago, Ethereum was trading under $100.
Ethereum (ETH/USD) Weekly Price Chart (September 2019 – April 30, 2021)
We suggested last week that the recent sell-off in the market may well lure buyers back into the space and this has been the case. Recent sell-offs in market leader Bitcoin continue to find buyers and this looks likely to continue. As always, the cryptocurrency space can, and has, made a sharp reversal in the face of positive sentiment and weekend markets bring extra volatility to the market so caution still needs to be exercised.
Bitcoin (BTC), Ethereum (ETH) Crumble, Alt-Coins Hammered – Will Buyers Step Back in Again?
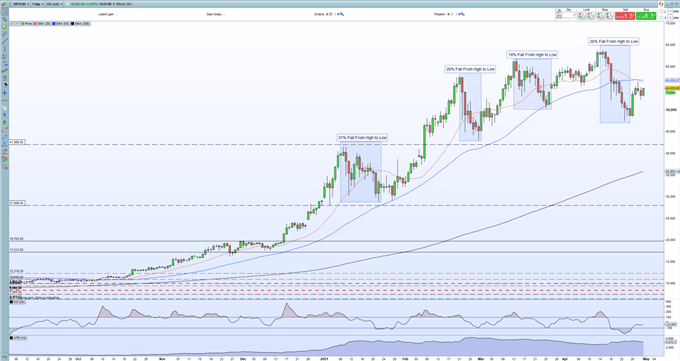
Heavy sell-offs in Bitcoin are not uncommon this year and if, as looks currently likely, history repeats itself it will not be too long before the market leader is back above $60k and eyeing new highs. The 20- and 50-day simple moving averages may present a short-term barrier to the next move higher.
Bitcoin (BTC/USD) Daily Price Chart (September 2020 – April 30, 2021)
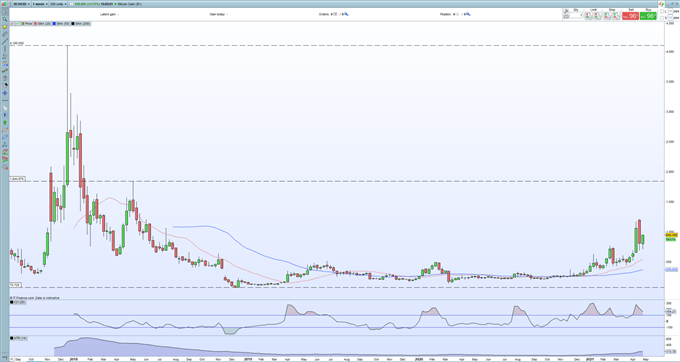
Bitcoin Cash (BCH) has had a strong week and continues to re-trace its recent heavy sell-off. Despite printing a 3-year high of $1,210 two weeks ago, BCH is still nowhere near its mid-December 2017 spike high of $4,100, suggesting that if the recent rising crypto tide is floating all boats, then BCH has further to go.
Bitcoin Cash (BCH/USD) Weekly Price Chart (September 2017 – April 30, 2021)
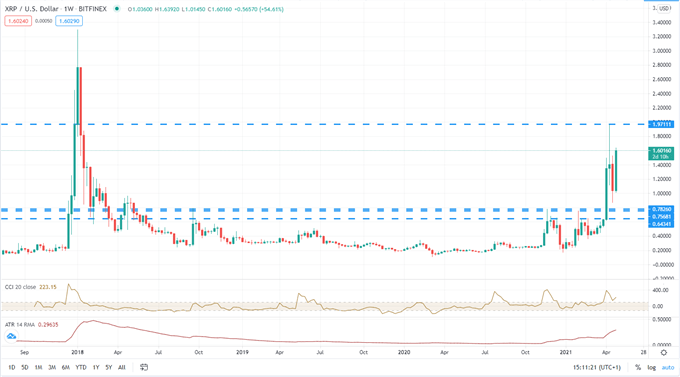
One of this week’s star performers is Ripple (XRP) which is up 15% today – $1.60 – and is nearly 50% higher over the last 7 days. Again Ripple has underperformed heavyweights Bitcoin and Ethereum over the last 3-years and stands at just half of its peak value in late December 2017.Ripple has a vocal, and strong, backing and may well continue to push higher still.
Ripple (XRP/USD) Weekly Price Chart (September 2017 – April 30, 2021)
Ripple chart made with TradingView
Traders of all levels and abilities will find something to help them make more informed decisions in the new and improved DailyFX Trading Education Centre
What are your views on Bitcoin (BTC), Ethereum (ETH) and Ripple (XRP) – bullish or bearish?? You can let us know via the form at the end of this piece or you can contact the author via Twitter @nickcawley1.


