- Bitcoin price shows renewed bullish momentum but faces an uphill battle as it climbs higher.
- Ethereum price rally continues despite multiple sell signals indicating it is overextended.
- Ripple price consolidates as it prepares for the next leg that could potentially hit new yearly highs.
Bitcoin price has begun its ascent, but Ethereum price leads the Monday’s rally after hitting a new all-time high today. XRP, on the other hand, is coiling up after its first run-up.
Institutions heed cryptocurrencies as investment assets
As new all-time highs are being erected multiple times in 2021, more and more institutional investors have come around to the idea of Bitcoin and other digital currencies as an alternative form of investment.
While many publicly-listed companies have previously invested in Bitcoin, MicoStrategy’s bet on Bitcoin in late 2020 is perhaps what kick-started this inflow of institutional investors.
Saylor tweeted on May 1 how Bitcoin, as an investment vehicle, trumps the S&P 500 in various aspects.
To do so, Michael Saylor uses S&P’s 12-month return as cost of capital and compares that with Bitcoin against multiple time frames.
The cost of capital is 47%. Consider the implications.
“The S&P 500 index is a benchmark of American stock market performance, dating back to the 1920s. The index has returned a historic annualized average return of around 10% since its inception through 2019.” pic.twitter.com/rVVsP6rTuE
— Michael Saylor (@michael_saylor) May 1, 2021
To sum it up, Saylor’s tweet shows that despite Bitcoin’s high volatility, its returns, Sharpe ratio and Sortino ratio are far better in a long-term investment.
Bitcoin price climbs higher
Bitcoin price bounced off a potential demand barrier that stretches from $56,054 to $57,967, hinting at a breach in an immediate resistance level at $59,972. If this were to happen, sidelined investors could jump on the bandwagon, pushing BTC to retest the all-time high at $64,895.
Only a decisive close above this level would keep this upswing intact. However, failing to do so will indicate a weak bullish momentum in the demand zone mentioned above. Therefore, short-term selling pressure could quickly invalidate this area of support, leaving Bitcoin price open to the risk of further downfall.
BTC/USD 1-day chart
Despite the current bounce, the Momentum Reversal Indicator has flashed a preemptive top signal in the form of a yellow candlestick on the daily chart. This sign indicates that a continuation of this momentum could produce a ‘perfect top’ reversal signal that forecasts a one-to-four candlestick correction.
A breakdown of the 50% Fibonacci retracement level at $56,070 will invalidate the bullish thesis and kick-start a bearish descent to $53,672.
Ethereum price ignores sell signs as it hits new all-time high
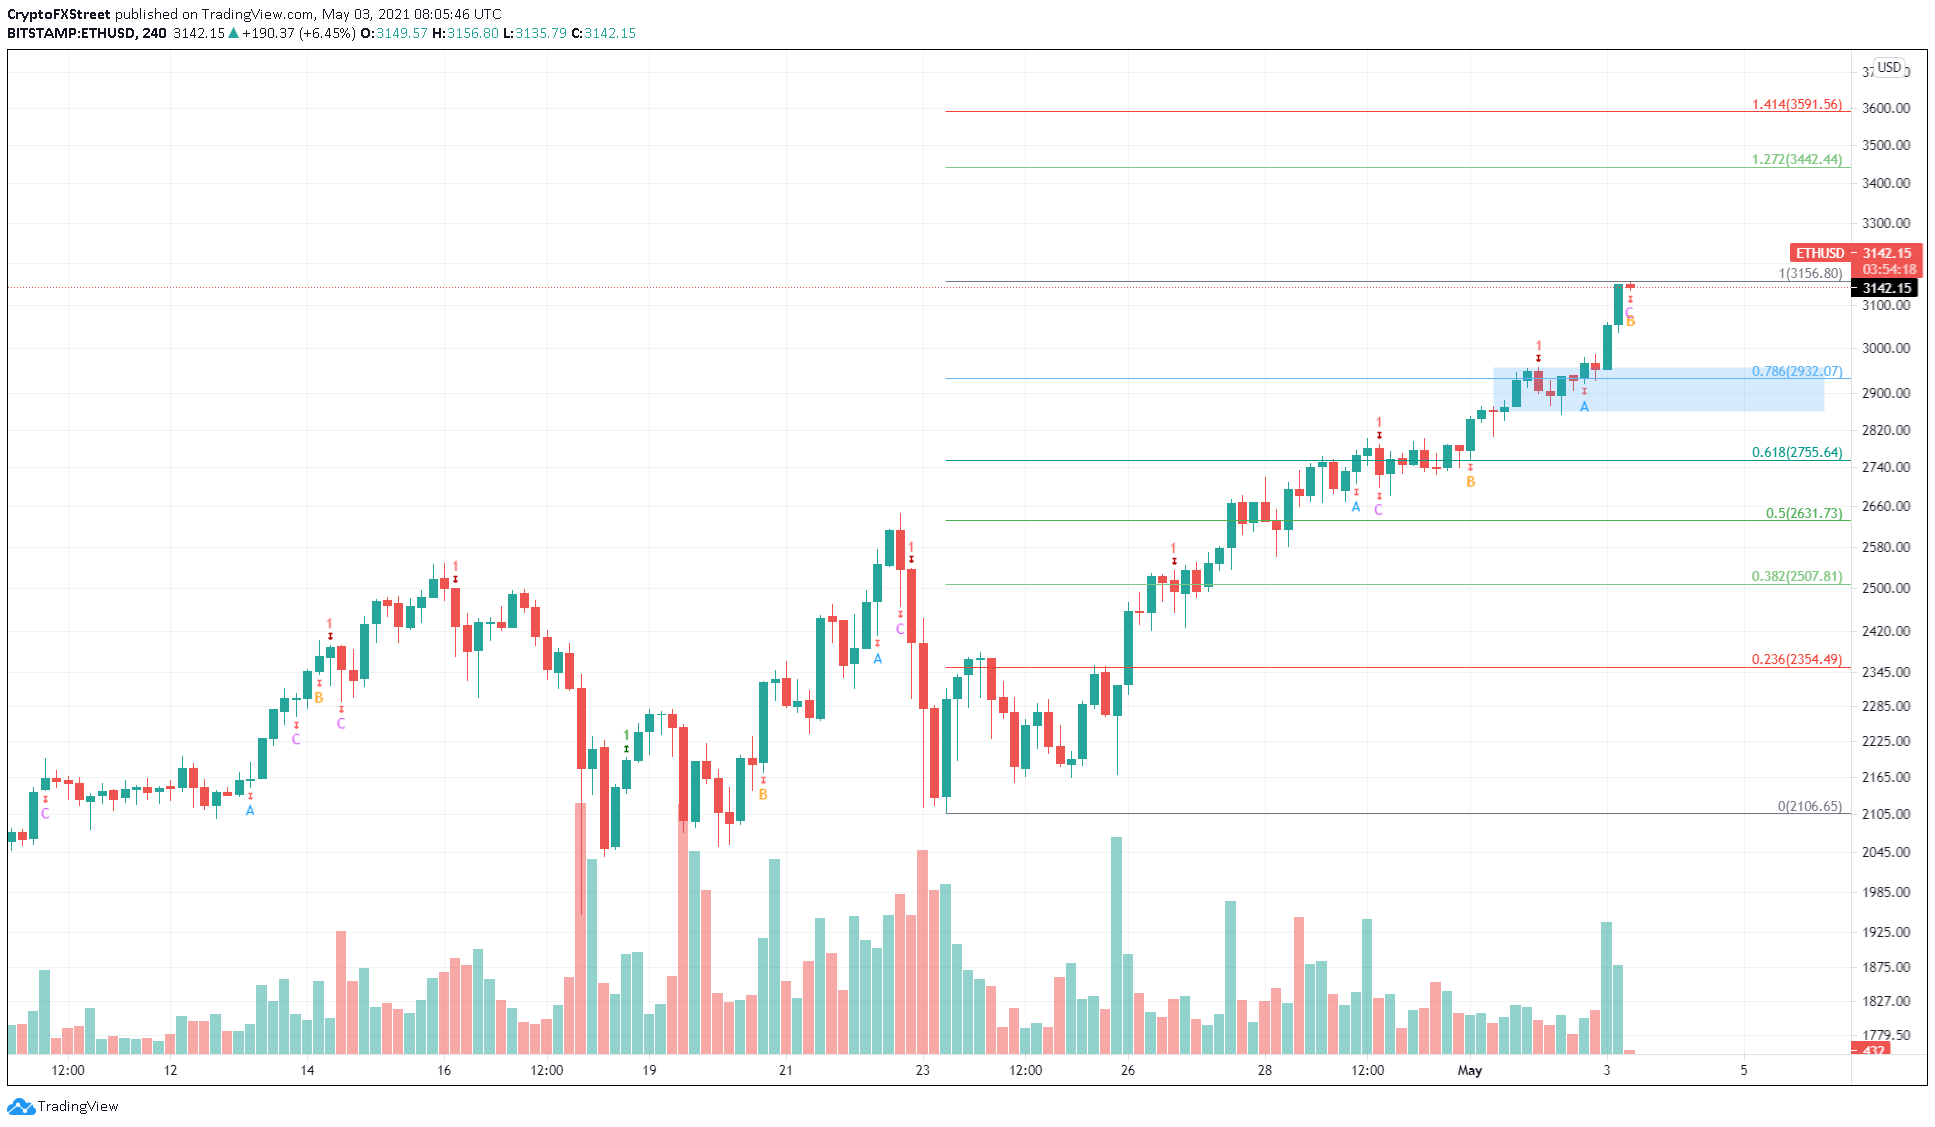
Ethereum price recently hit an all-time high as it passed $3,000. The 4-hour chart shows multiple sell signals in the form of red ‘one’ candlesticks but each faced extinction as bulls kept propping up the pioneer altcoin’s market value.
However, if this steady upswing continues, ETH may hit the 127.2% Fibonacci extension level at $3,442.
ETH/USD 4-hour chart
At the time of writing, the current four-hour candlestick flashed extensions B and C simultaneously, suggesting that a retracement is long overdue. Hence, if investors start booking profits, Ethereum price could slide 6.3% to the demand zone extending from $2,860 to $2,956.
A breakdown of $2,860 will trigger a new downtrend that could extend up to the next support barrier at $2,755.
Ripple price is coiling up after its second run-up
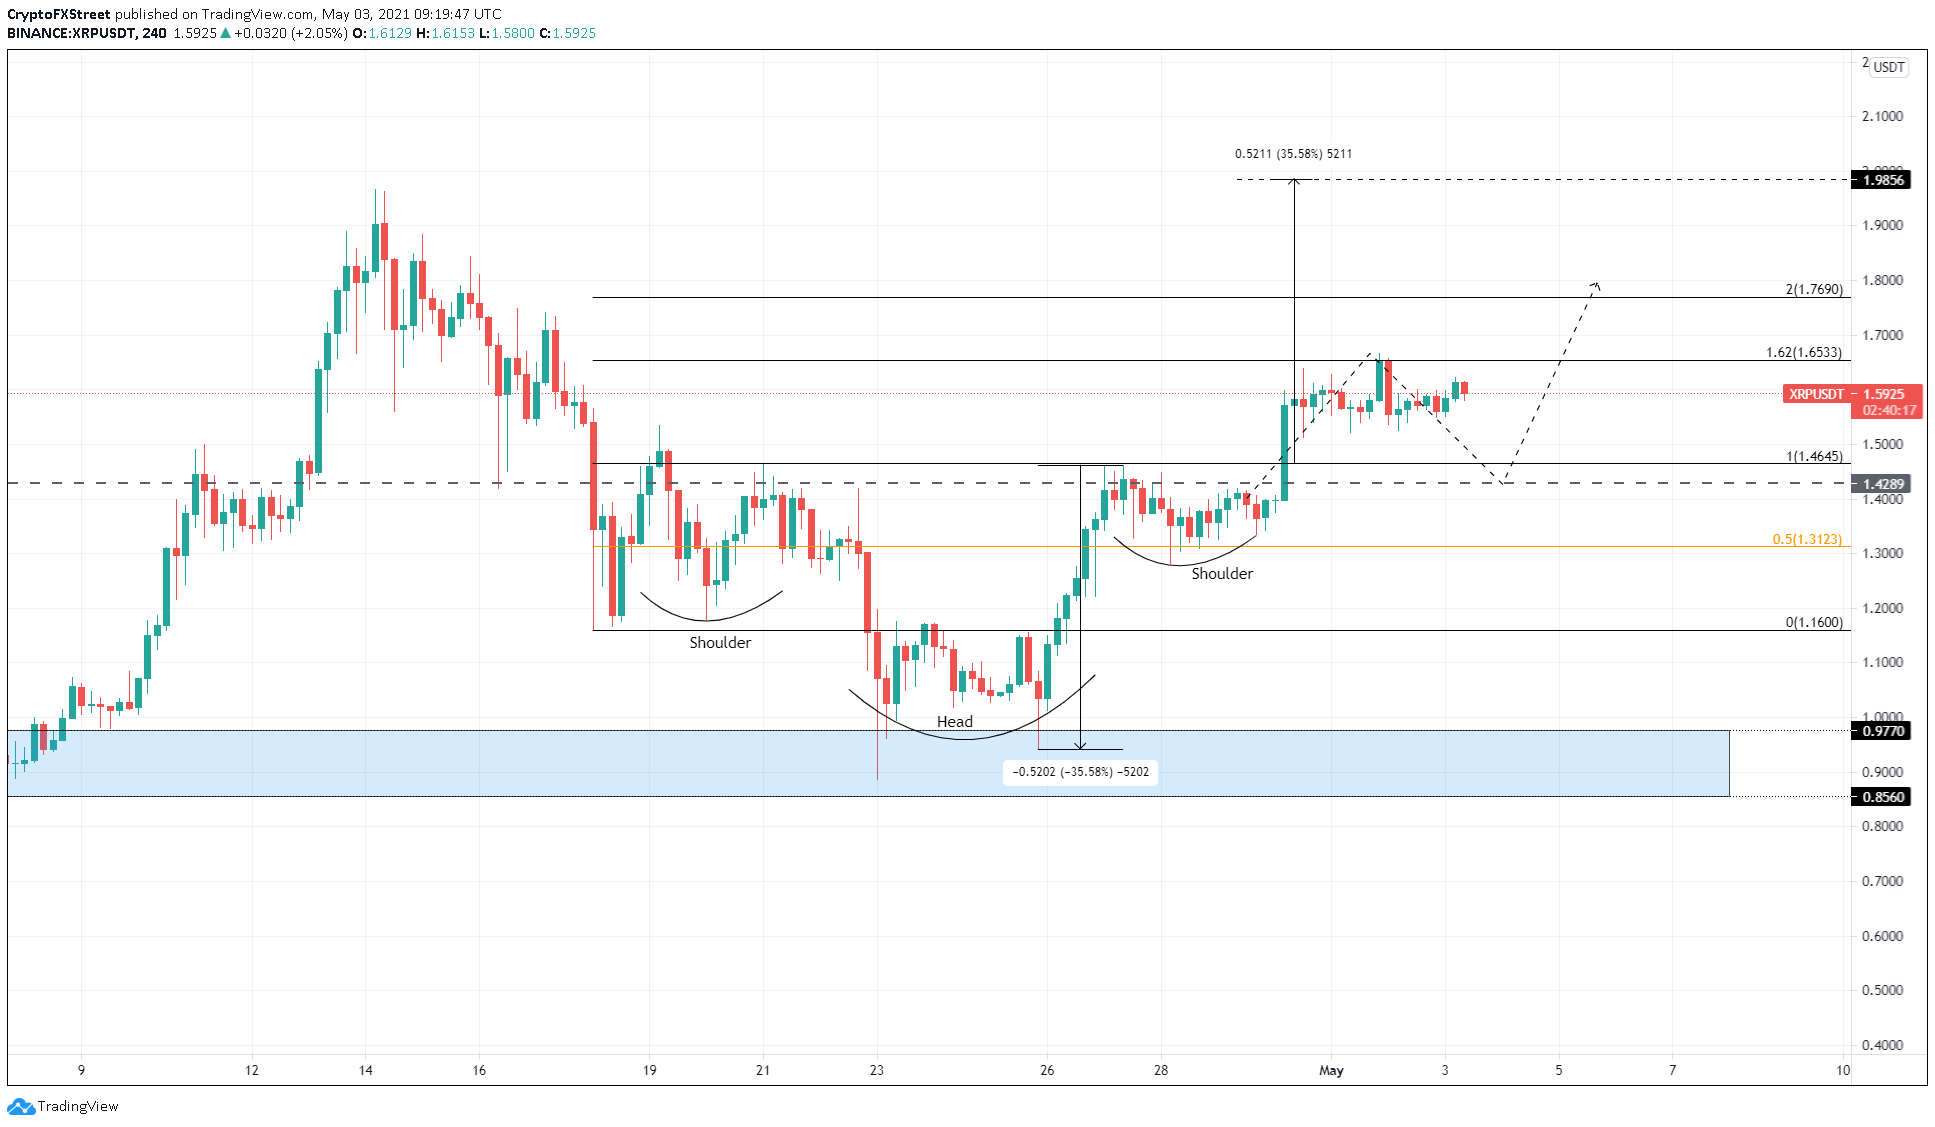
Ripple broke out of a bottom reversal pattern known as inverse head-and-shoulders on April 30. Since then, XRP has rallied nearly 19% to hit a blockade at $1.65.
Following this, the remittance token began its consolidation in the form of a downward sloping trend. A resurgence of buyers could shatter the $1.63 resistance barrier, allowing it to surge to its intended target at $1.98, a new yearly high.
XRP/USDT 4-hour chart
Regardless of the bullish outlook, if the XRP price fails to breach the supply level at $1.65 for the second time, investors could expect the remittance token to slide to the support barrier at $1.42.


