
Bitcoin crashed by more than 30% followed by Ethereum, XRP down by 40% and Dogecoin promoted by Elon Musk of Tesla was also down by 45%. And, yes, this fall is a single-day crash across the Digital coins.
The news that is being said to be responsible for the crash – Beijing’s ruling which highlighted that financial institutions must no longer accept cryptocurrency as payment.
So, do you really think that is what led to the crash or the charts suggested that a crash is imminent as soon as the support levels were broken?
See below to get the answers for yourself:
Bitcoin / USD chart: Hurst’s Time Cycles
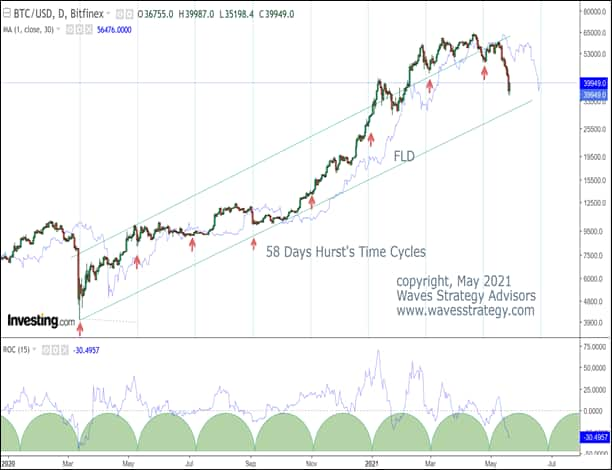
Time Cycle analysis:
J. M. Hurst known as the father of cycles has done a lot of scientific work not only in space of physics but also in the application of Cycles on the stock market. He identified a set of nominal cycles that are working across the scientific field and can be extended to the cyclicality of freely traded assets as well.
We will not dwell on the theory as of now.
We have applied the 58-days Time Cycle which is in close approximation to Hurst’s Nominal cycle of 56 days on BTC/USD.
The same looks to be working extremely well and we can see every time prices formed a bottom on this cycle day on most of the occasions.
In the recent event, the cycle low was broken near 48400 levels thereby suggesting that the major cycle has topped out and a crash is imminent. This low was broken on 13th May 2021.
China news of asking financial institutions to stop dealing in crypto currency came only on 19th May 2021. Much before that itself the charts clearly suggested cycles have topped out and supports are broken.
When the low created by the earlier cycle is taken out it indicates that a top is formed until the next cycle low kicks in. The next cycle low is due only by the last week of June 2021.
Forecasting price targets using Time – Yes, this is yet another amazing concept that is explained as per Hurst’s Time Cycles by plotting a simple indicator known as Future Line of Demarcation (FLD) shown on the chart.
In a nutshell, Hurst’s Time cycles suggested enough proof much ahead of the crash that this crypto currency trend is reversing and prices have topped out for atleast a few weeks if not months.
Anyone paying attention to this simple cycle analysis would have been able to trade this currency with amazing accuracy.
Going ahead the top made near 59250 levels will remain protected until 20th June and any rallies can be used as shorting opportunity as the cycles remain in “Sell Mode”
Disclaimer: The views and investment tips expressed by experts on Moneycontrol.com are their own and not those of the website or its management. Moneycontrol.com advises users to check with certified experts before taking any investment decisions.