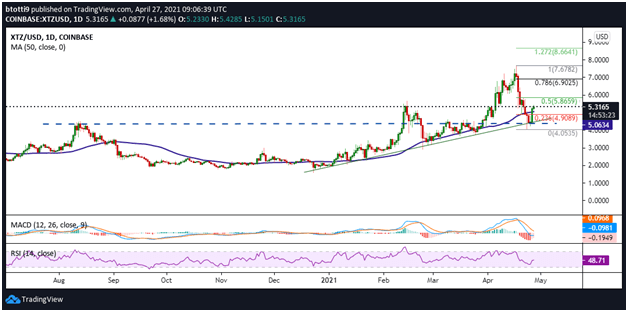
XTZ price has traded above a key bullish trendline since December 2020
Tezos (XTZ) is up 10% in the past 24 hours, and nearly 22% in the past two days, to trade above $5.30.
The gains follow a significant decline after bears moved in, as prices reached an all-time high of $7.67 on 17 April. Despite the declines, the cryptocurrency’s market outlook suggests it will remain bullish.
Tezos price outlook
The weekly chart shows XTZ/USD has recovered above a major horizontal support line near $4.47. The cryptocurrency is also trading along a bullish trend line formed since mid-December 2020.
Technical indicators also add to the overall perspective of a potential breakout. The weekly RSI is highlighting a positive divergence above 50, while the MACD remains bullish.
The above picture suggests that XTZ price remains bullish as long as prices hold above the ascending trend line and the 21-week moving average ($3.84).
On the daily chart, Tezos price is trading above an ascending trendline formed since 24 December last year. Bulls have defended gains above this line multiple times since, with the latest bounce coming at the demand zone near $4.40.
Currently, the XTZ/USD pair is above the 50 SMA, a critical price level that adds to the optimistic view of short-term action.
If the upside continues, the primary resistance level is at $5.86, an area marked by the 0.5 Fibonacci retracement level of the downswing from $7.67 to $4.05.
A clear break above this level could call for more buy orders that could help push prices towards $6.90 and an attempt for a new all-time high.

However, traders might need to watch the market for a broader direction given the MACD’s recent bearish crossover and the daily RSI’s current location below the 50 mark.
If a contrary move occurs, an immediate anchor would be the 50 SMA. The 0.236 Fib level ($4.90) provides another cushion should bears take command, with the horizontal line at $4.40 providing a strong demand zone.
