BITCOIN PRICE OUTLOOK: BTC/USD DEFENDS 100-DAY SIMPLE MOVING AVERAGE AS TESLA REPORTS PROFIT FROM CRYPTO HOLDING, XRP/USD EXPLODES HIGHER
Bitcoin (BTC/USD) and other cryptocurrencies like Ripple (XRP/USD) and Ethereum (ETH/USD) are soaring today. XRP/USD price action is leading the way with a near 20% gain on the session, followed by BTC/USD and ETH/USD up about 10% and 6%, respectively. The sharp extension higher across digital assets could be in response to some positive news flow – like JPMorgan announcing a new Bitcoin fund offering to wealthy clients or Tesla earnings showing a whopping $101-million gain on the sale of Bitcoin. This reinforces the growing theme of private sector acceptance. A broadly weaker US Dollar headed into this Wednesday’s Federal Reserve meeting is likely helping boost crypto too. That said, the moves do look technically charged as well.

Recommended by Rich Dvorak
Trading Forex News: The Strategy
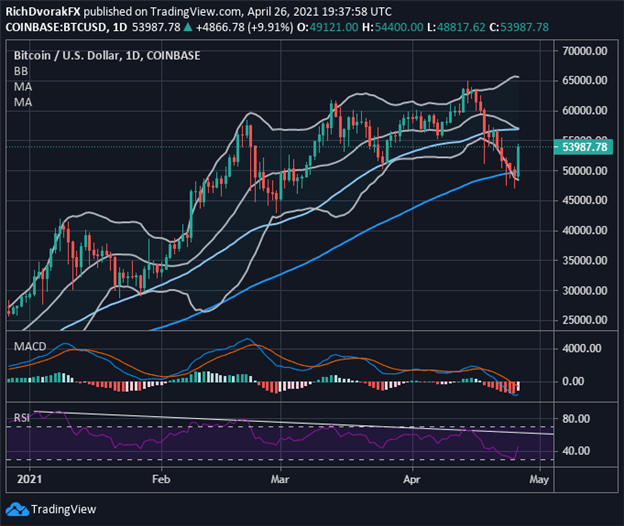
BTC/USD – BITCOIN PRICE CHART: DAILY TIME FRAME (27 DECEMBER 2020 TO 26 APRIL 2021)
Chart by @RichDvorakFX created using TradingView
We noted in our last Bitcoin forecast that BTC/USD price action looked like it was headed slightly lower for a technical support test of the psychologically-significant $50,000 level. Bitcoin bulls seem to be making a strong defense there, which is an area of buoyancy underpinned by its 100-day simple moving average. This appears to have invalidated the short-term bearish trend and could open up the door for BTC/USD price action to extend its rebound toward the 20-day and 50-day simple moving averages before year-to-date highs come back into focus.


Recommended by Rich Dvorak
Get Your Free Introduction To Bitcoin Trading
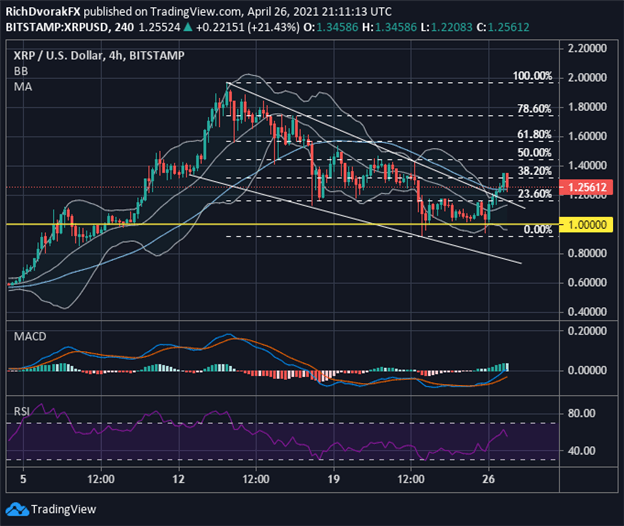
XRP/USD PRICE CHART: 4-HOUR TIME FRAME (04 APRIL TO 26 APRIL 2021)
Chart by @RichDvorakFX created using TradingView
As for Ripple, the fourth largest cryptocurrency by market cap, there seems to be hints of an end to its recent consolidation lower. XRP/USD price action appears to have broken out from its bullish falling wedge chart pattern after basing around the 1.0000-price level. Ripple bears have been pushing back at resistance posed by the 38.2% Fibonacci retracement so far, but buying pressures may prevail as risk trends remain favorable and supportive of speculative assets. To that end, the latest Bollinger Band expansion and upswing in the slope of its 20-period moving average on a four-hour chart serve as constructive technical developments for XRP/USD bulls.


Recommended by Rich Dvorak
Get Your Free Top Trading Opportunities Forecast
— Written by Rich Dvorak, Analyst for DailyFX.com
Connect with @RichDvorakFX on Twitter for real-time market insight


