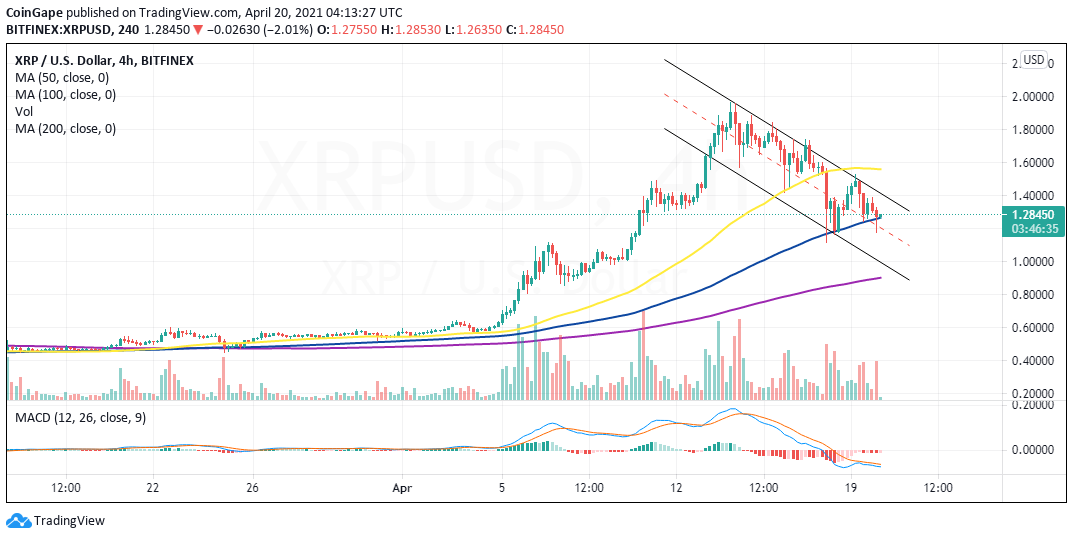
- Ripple has continued to lose ground from April highs around $1.95 toward $1.
- Breaking under the descending channel’s middle boundary’s support could trigger massive losses toward $0.9.
Ripple was one of the best-performing cryptocurrencies in the first two weeks of April. The cross-border token made giant slides not seen since the breakdown in December when the United States Securities and Exchange Commission (SEC) filed a lawsuit against Ripple Labs and its top executives for selling unregistered tokens to raise funds.
Ripple suffered a rejection near $2 last week. However, support at $1.6 ensured that the bearish advances were checked while market stability protected. However, volatility swept across the market on Sunday, leaving most investors wrecked.
Bitcoin dropped close to $50,000 from highs above $60,000 while Ethereum extended the bearish leg to $2,000. The international remittance token hit lows around $1.12 before a reflex recovery pulled XRP slightly above $1.5.
Nonetheless, the entire cryptocurrency market has continued to suffer under the aggressive bears’ hands. Ripple is back to seeking support at $1.2 while holding firmly to the descending channel’s middle boundary support. The 100 Simple Moving Average (SMA) is also in line to prove the much-needed refuge, in turn, averting potential losses toward $1.
XRP/USD four-hour chart

The Moving Average Convergence Divergence (MACD) indicator affirms that the slightest resistance path is downward. This indicator tracks the asset’s trend and measures its momentum. The MACD line (blue) is stuck under the signal line, adding credence to the bearish outlook.
Ripple intraday levels
Spot rate: $1.28
Trend: Bearish
Volatility: Low
Support: 1.2 and the 100 SMA
Resistance: $1.4 and the 50 SMA
To keep track of DeFi updates in real time, check out our DeFi news feed Here.


Share on Facebook
Share on Twitter
Share on Linkedin
Share on Telegram