- Bitcoin price shows a sharp spike on April 26, which has run into a stiff resistance barrier around $53,000.
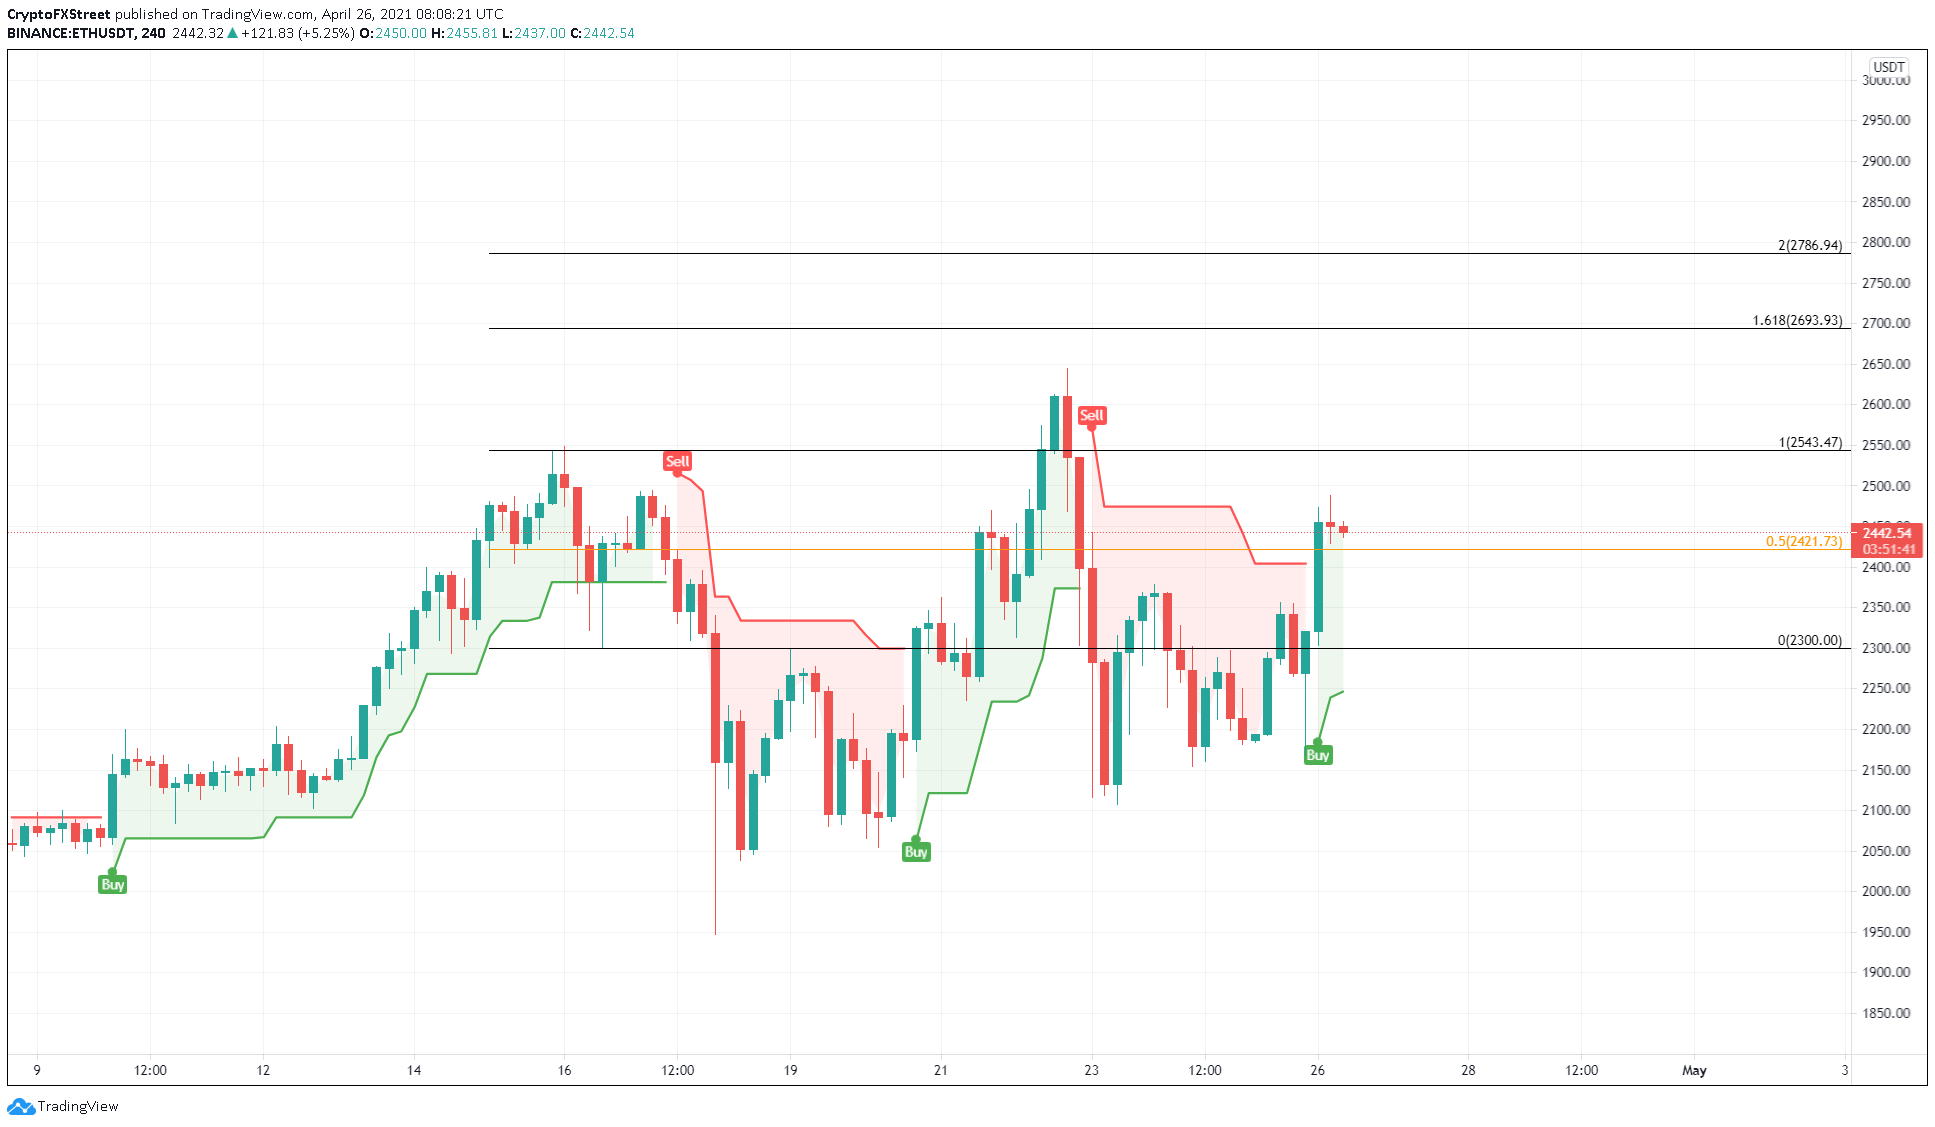
- Ethereum price has overtaken the 50% Fibonacci retracement level at $2,421 and eyes to retest the all-time high at $2,644.
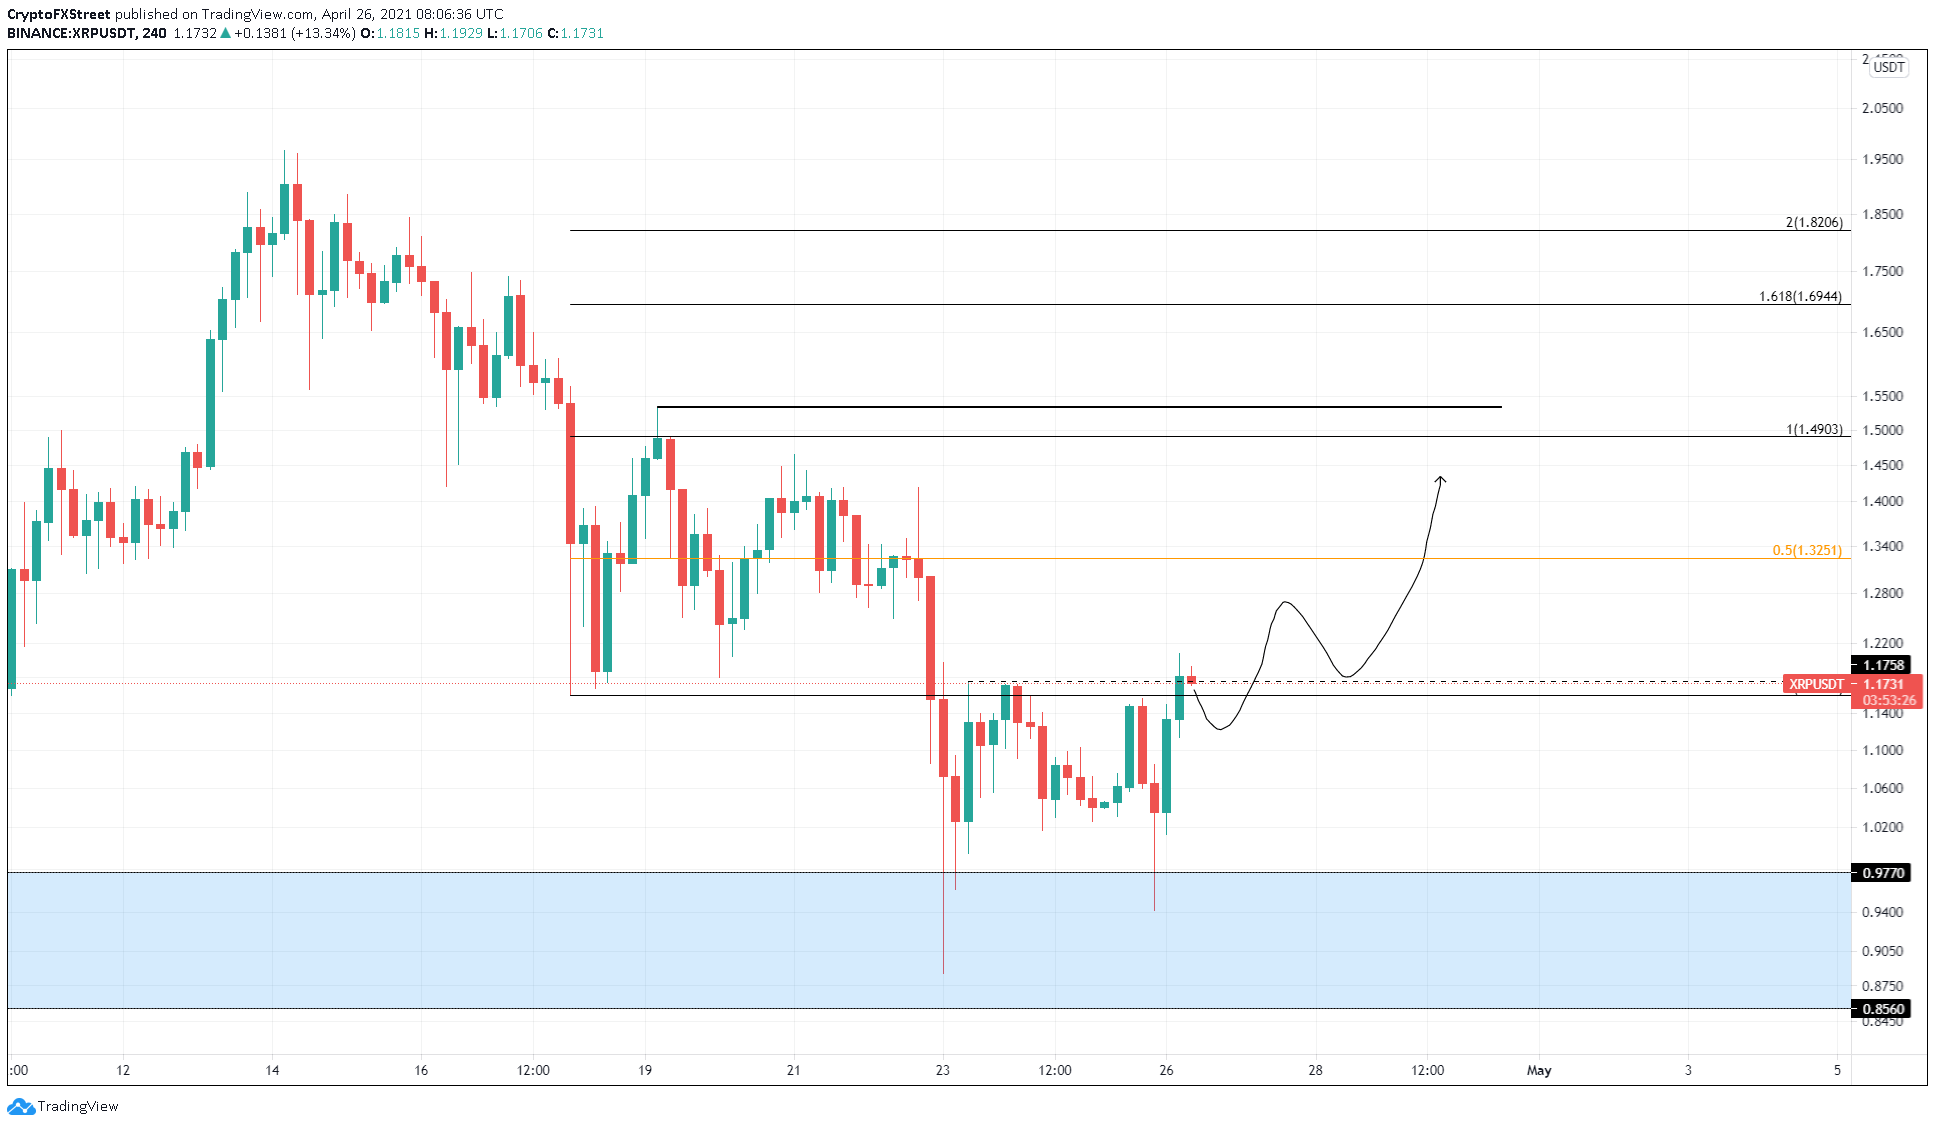
- XRP price seems to be in sync with the market, suggesting a move toward $1.32 and $1.49.
Bitcoin price shows some strength for the first time in three days as it surged toward a crucial supply zone. Since the pioneer crypto and the stock market have shown signs of being in sync since early this year, the cryptocurrency ecosystem might feel the ripples of the market’s earnings season, set to happen this week.
Earnings season and its influence on cryptocurrency market
Jim Cramer, the host of Mad Money on CNBC, stated that this week would have plenty of buying opportunities since the earnings season was in full swing.
He added,
There will be reports next week that are met with negativity and not all of them will be genuinely bad, so I’m urging you to take advantage of that weakness.
Biden’s tax increase caused both the markets to collapse in tandem, albeit Bitcoin’s crash far deeper. Although selecting one data point out of many to suit a specific need would be cherry-picking, BTC has shown a higher degree of correlation with the S&P 500 from the start of 2021.
Since the cryptocurrency market is recovering nicely, an optimistic outcome for the traditional market next week should have a bullish impact on BTC prices.
Bitcoin price goes headfirst into supply zone
Bitcoin price shows an 8.5% increase over the last 8 hours, which has pierced the resistance barrier that extends from $52,570 to $53,826. A decisive close above $53,826 could attract sidelined investors to jump on the BTC bandwagon.
In such a case, BTC could surge 12% to retest the pre-crash area at $60,284. A persistence of bullish actors could further propel Bitcoin price to $62,000, coinciding with the 200% Fibonacci extension level.
BTC/USDT 4-hour chart
On the flip side, a failure to break the supply zone would result in a drop to $50,931, followed by another 6.75% slump to $47,500.
Ethereum price leads by example
Ethereum price has been on a tear despite two crashes. ETH is currently trading around $2,442 after surging nearly 15% from its lowest point during last week’s sell-off. This uptrend in the smart contracts token shows the resilience of buyers and their optimism.
A bounce from the 50% Fibonacci retracement level at $2,421 will signal the persistence of a bullish outlook. In this case, investors can expect Ethereum price to surge 8.7% to retest the record highs at $2,644.
The SuperTrend indicator’s recently spawned buy signal adds a tailwind to this scenario.
ETH/USDT 4-hour chart
Regardless of the bullishness surrounding the pioneer altcoin, if $2,421 is breached, Ethereum price might head toward $2,300. A breakdown of this level might invoke a retest of the $2,235 support level.
XRP price looks to retest $1.50
XRP price has shed nearly 55% since its top on April 14. At the time of writing, the remittance token has recovered 30% from $0.88 to $1.16, where it currently stands.
A decisive close above $1.17 will create a higher high and signal the start of an uptrend. In such a case, XRP price could jump 13% to the 50% Fibonacci retracement level at $1.32. A further pile-up of bid orders could propel Ripple to $1.50.
XRP/USDT 4-hour chart
If XRP investors decide to book profit and, failing to produce a 4-hour candlestick close above $1.17, an extended consolidation could ensue. Here, XRP price might tap the demand zone’s upper trend line at $0.97.


