The cryptocurrency markets are in full boom with the announcement of new projects every other day. Today we will analyse the prices of some of the Altcoins, DOGE, SC, and EOS. The year 2021 has proved to be the biggest of the Alt Seasons so far with almost every currency hitting their ATH.
It is a known factor that the majority of the altcoin prices follow the lead of Bitcoin in the Crypto markets. Bitcoin is pivoting around the ATH levels, which is helping a lot of coins to be bullish.
Also, Just because the markets are bullish, we cannot blindly take it for granted. Hence we present to you the market analysis of the Altcoins as follows.
Technical Price Analysis of Dogecoin – DOGE
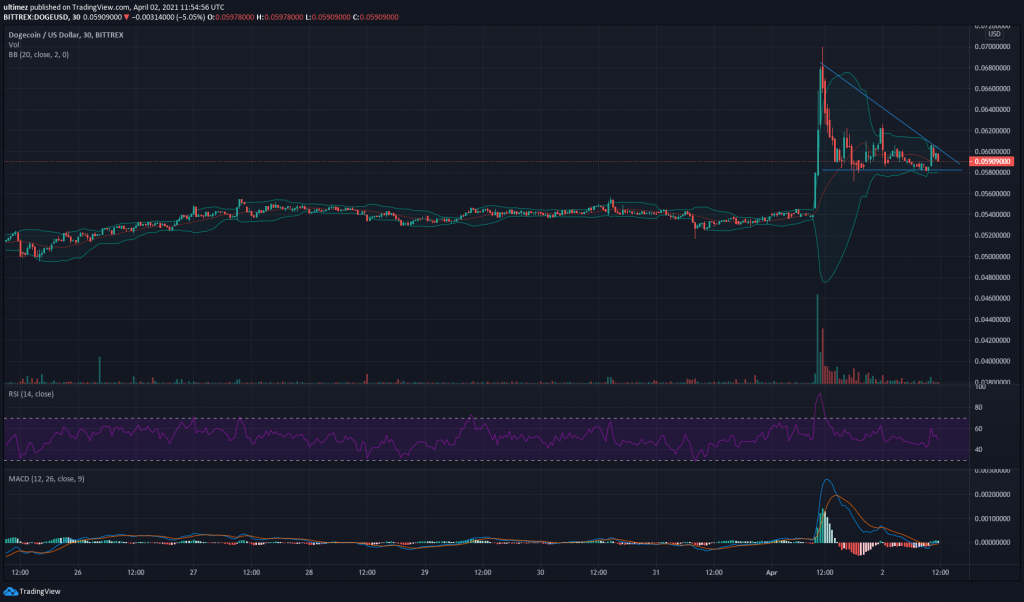
Dogecoin has resorted to consolidation after a surge on April 1, 2021. The reason for this surge was a Tweet made by the Billionaire entrepreneur Elon Musk. The DOGE hit $0.066 on 1st April, later plunged to $0.05918 due to selling pressure.
The current Market capitalization of Dogecoin is $7,637,398,078, making it the #18 crypto on CoinMarketCap. Transaction volumes increased to a whopping $4.62 Billion with a 171.19% change in just 24 hours. The total circulating supply of DOGE is 129,017,654,677 DOGE as of now.

The Doge is forming a Flat-bottom descending triangle with support at $0.058, with next support at $0.054. The Resistances are $0.060, $0.062, $0.068. There is a possibility to break out and follow the uptrend if the buyers take charge of the market.
The RSI is at 48 indicating that price action could drive the trend.
MACD is turning slightly bullish, with sufficient overhead for an uptrend. The price is following the Bollinger band contraction.
As observed earlier, the token tends to lose its uptrend if there is no sufficient news to pump the prices. A coin created as a parody has become one of the top 20 cryptos.
Support: $0.058, $0.054
Resistance: 0.060, $0.062, $0.068
RSI: 48
MACD: Neutral to Bullish
Technical Price Analysis of Siacoin – SC
Siacoin(SC) has reached $0.03252 with a 20% jump. The Market capitalization of SC reached $1,536,675,251 with this rise. The volumes of exchange also increased by 100%, worth up to $476,088,920 in the last 24 hours.
Siacoin has been steadily gaining momentum and formed an ascending parallel pattern indicating an uptrend on the 30 minute Candle chart Pattern. The price can expect support at $0.03, $0.028, $0.0264.

The resistance level is $0.032. The RSI at 61, near the bought zone. However, there is sufficient overhead. MACD and Bollinger bands indicate the bulls taking control of the market. The Experts suggest that the parallel ascending pattern may continue or there could be corrections and consolidation before any uptrend for Siacoin.
Support : $0.03, $0.028, $0.0264
Resistance : $0.032
RSI : 61
MACD : Bullish
Technical Price Analysis of EOS
EOS has been ranked as the 24th currency in terms of Market capitalization according to CoinMarketCap. It boasts a $5,347,804,387 cap with 952,189,014 EOS in circulating supply. The current Market capitalization is estimated by considering the LTP of $5.62.

The 30 minutes candle chart shows a Cup and handles pattern taking shape. Although the cryptomarkets have been bullish this year, this is one of the currencies which could not reach ATH prices. But the rise has been phenomenal with a 16.86% it is performing well above its ICO price.
The possible supports are at $5.5, $5.2, $4.8, which can hold the prices if there is a trend reversal and prices drop. The Resistance is offered at $5.7, $5.8, $6.0. The RSI stands at 55, which is a neutral level. MACD is neutral to bullish. The Bollinger bands are converging indicating a major move after consolidation.
Supports : $5.5, $5.2, $4.8
Resistance : $5.7, $5.8, $6.0
RSI : 55
MACD : Neutral to Bullish
