Litecoin (LTCUSD)
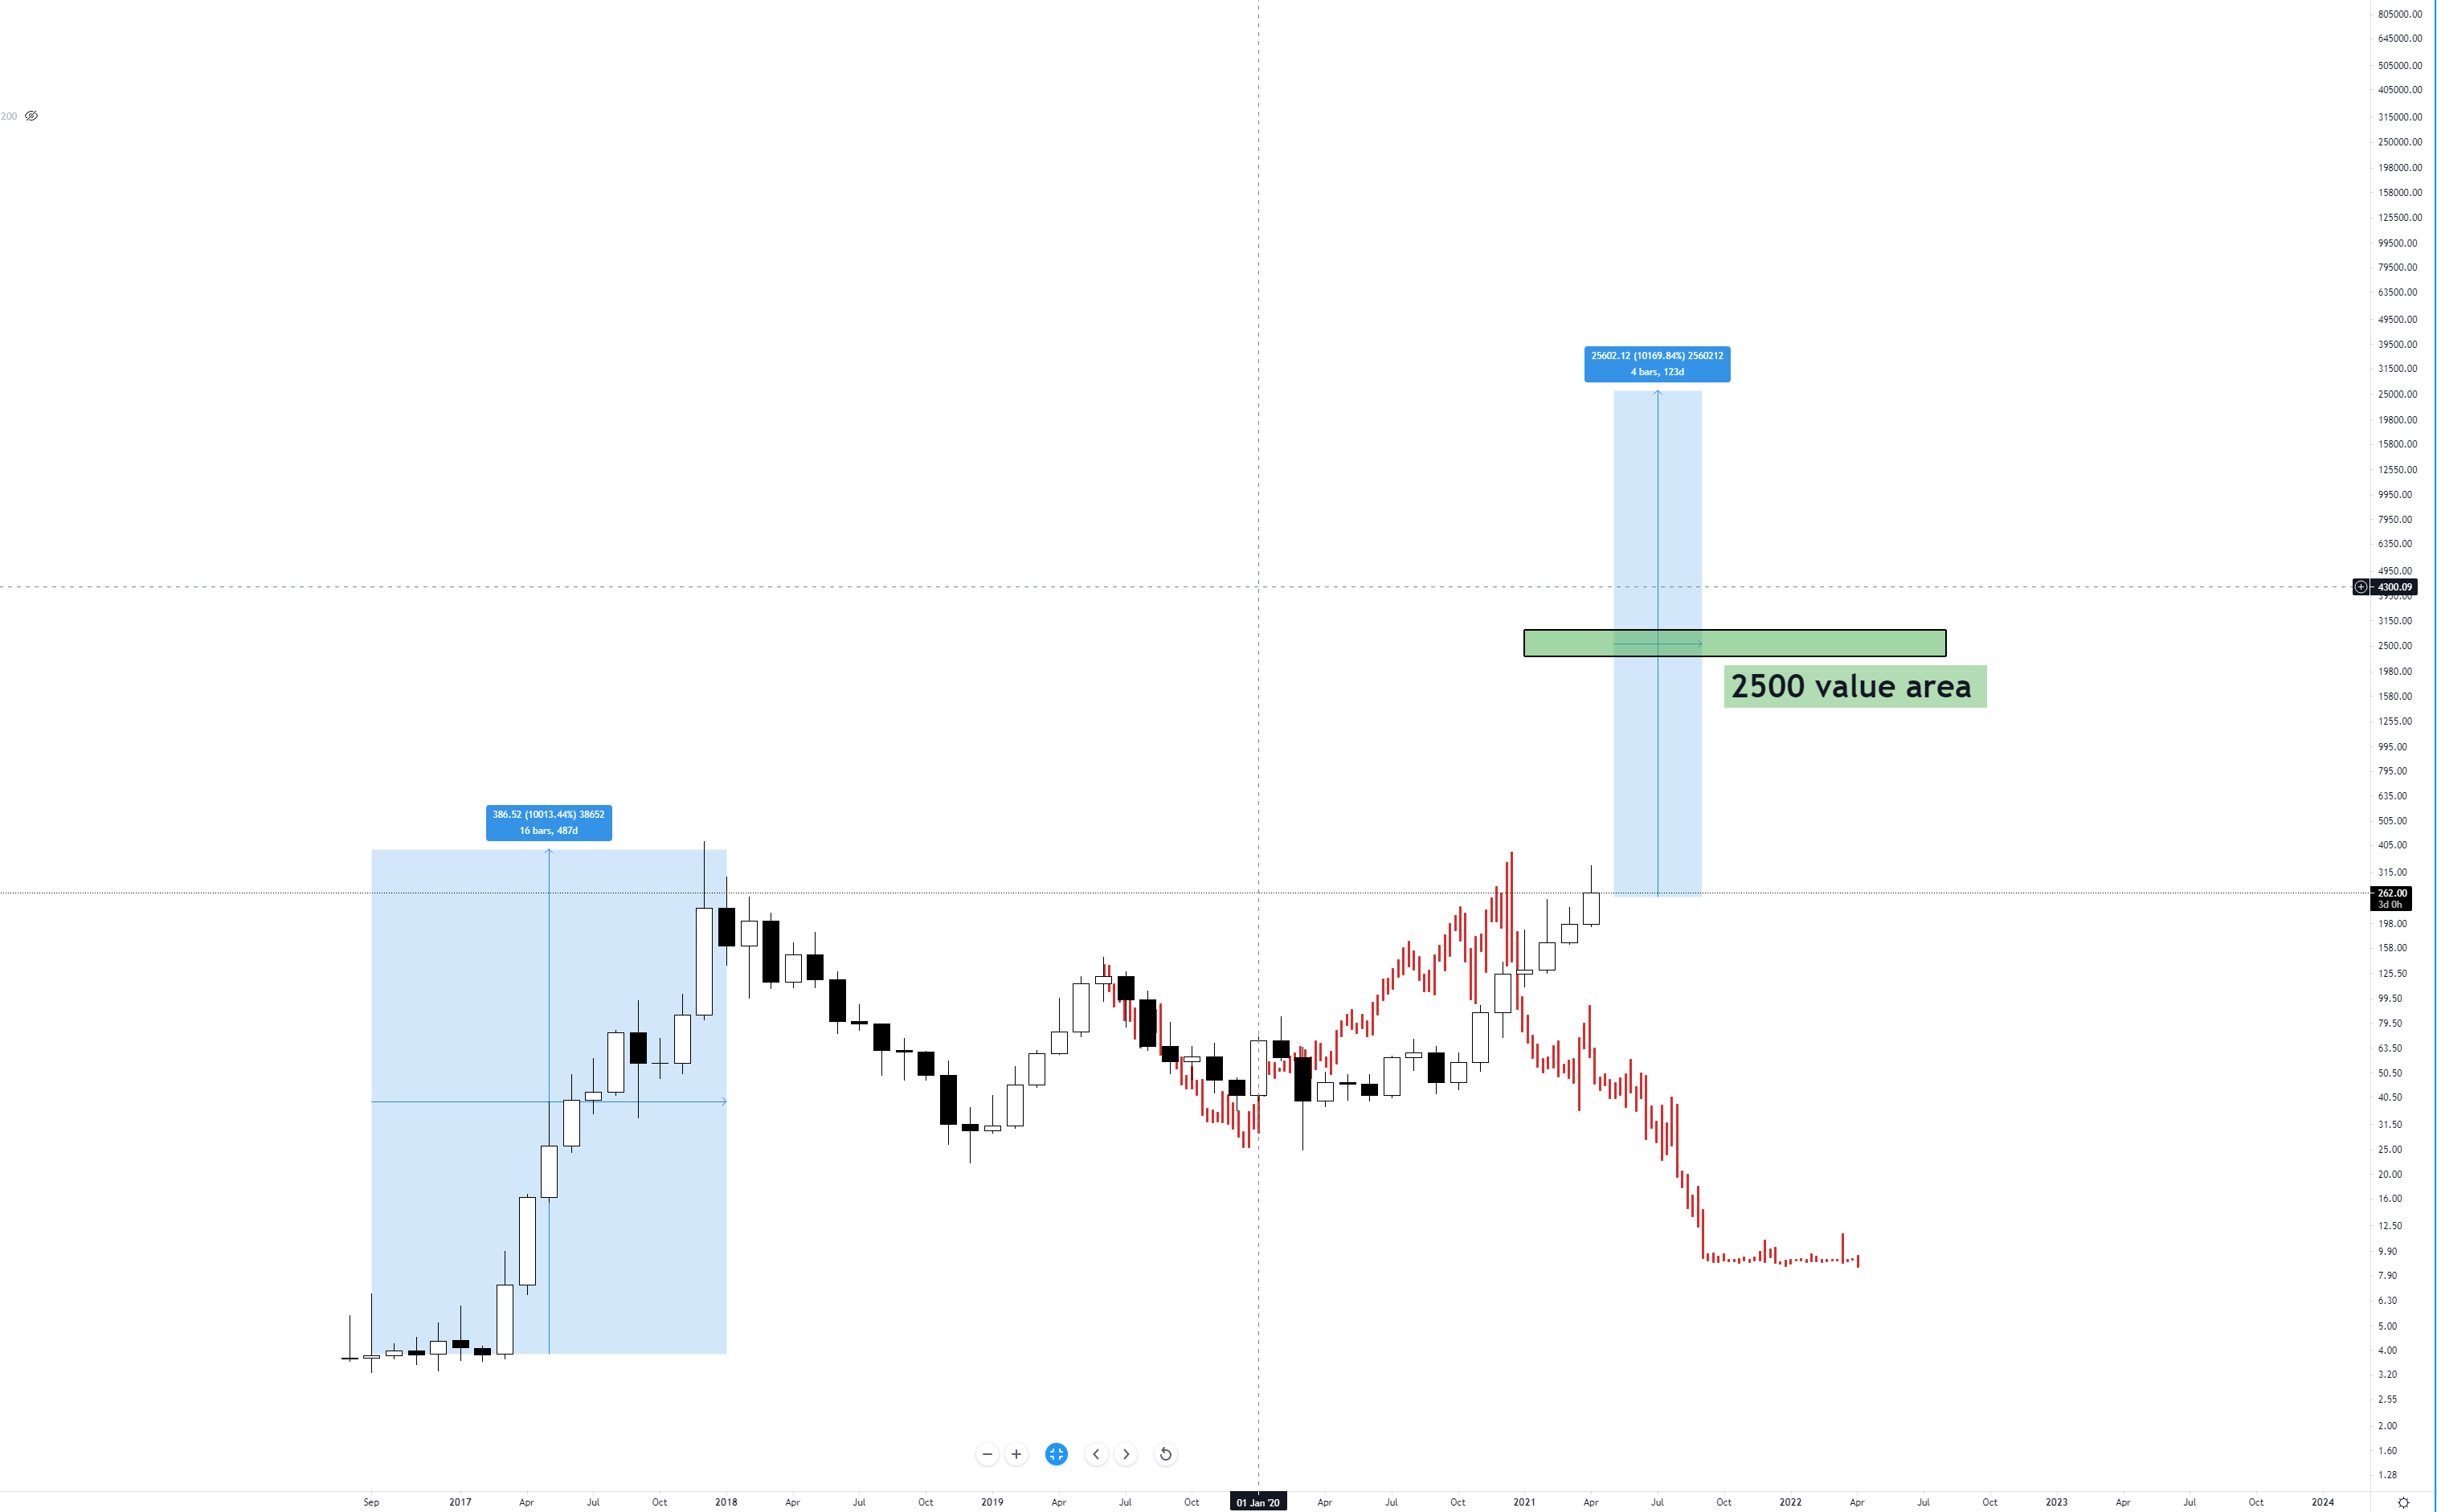
Above: Litecoin (LTCUSD) Monthly Chart
In my video for Litecoin today, I discuss how we can project Litecion’s future new all-time high utilizing a foldback and simple price measure tool. Litecoin still hasn’t reached its prior all-time highs even though every single other crpyotcurrency seems to have reached its prior all-time highs and then exceeded them by large margins. Litecoin might just be thrown into the dustbin of cryptocurrency history, but it is nonetheless and important cryptocurrency form an institutional standpoint. It’s still considered one of the primary ‘three’ cryptocurrencies. I don’t expect to see Litecoin trade the same down swing in the foldback pattern. Instead, I expect it to do the same swing, but higher (a mirrored foldback). If we measure the move from the lows from the beginning of Litecoin’s chart to the all-time high in 2017, we see an insane 10,000+% move. If we apply that same percentage move to the present value area, then we would see Litecoin trading at 25,000 – not likely. Instead, we need to be a little more ‘realistic’ (which is hard to do in this space) with our projections. I’ve instead focused on 50% of the range and that provides us with a more realistic level of 2500. I’d only be interested in trading to that level if Litecoin can break the 420 value area and hold it as support.
READ: Cryptocurrency Buy Signals for Cardano (ADA), Ethereum (ETH), Binance Coin (BNB) and Bitcoin (BTC)
Cardano (ADAUSD)
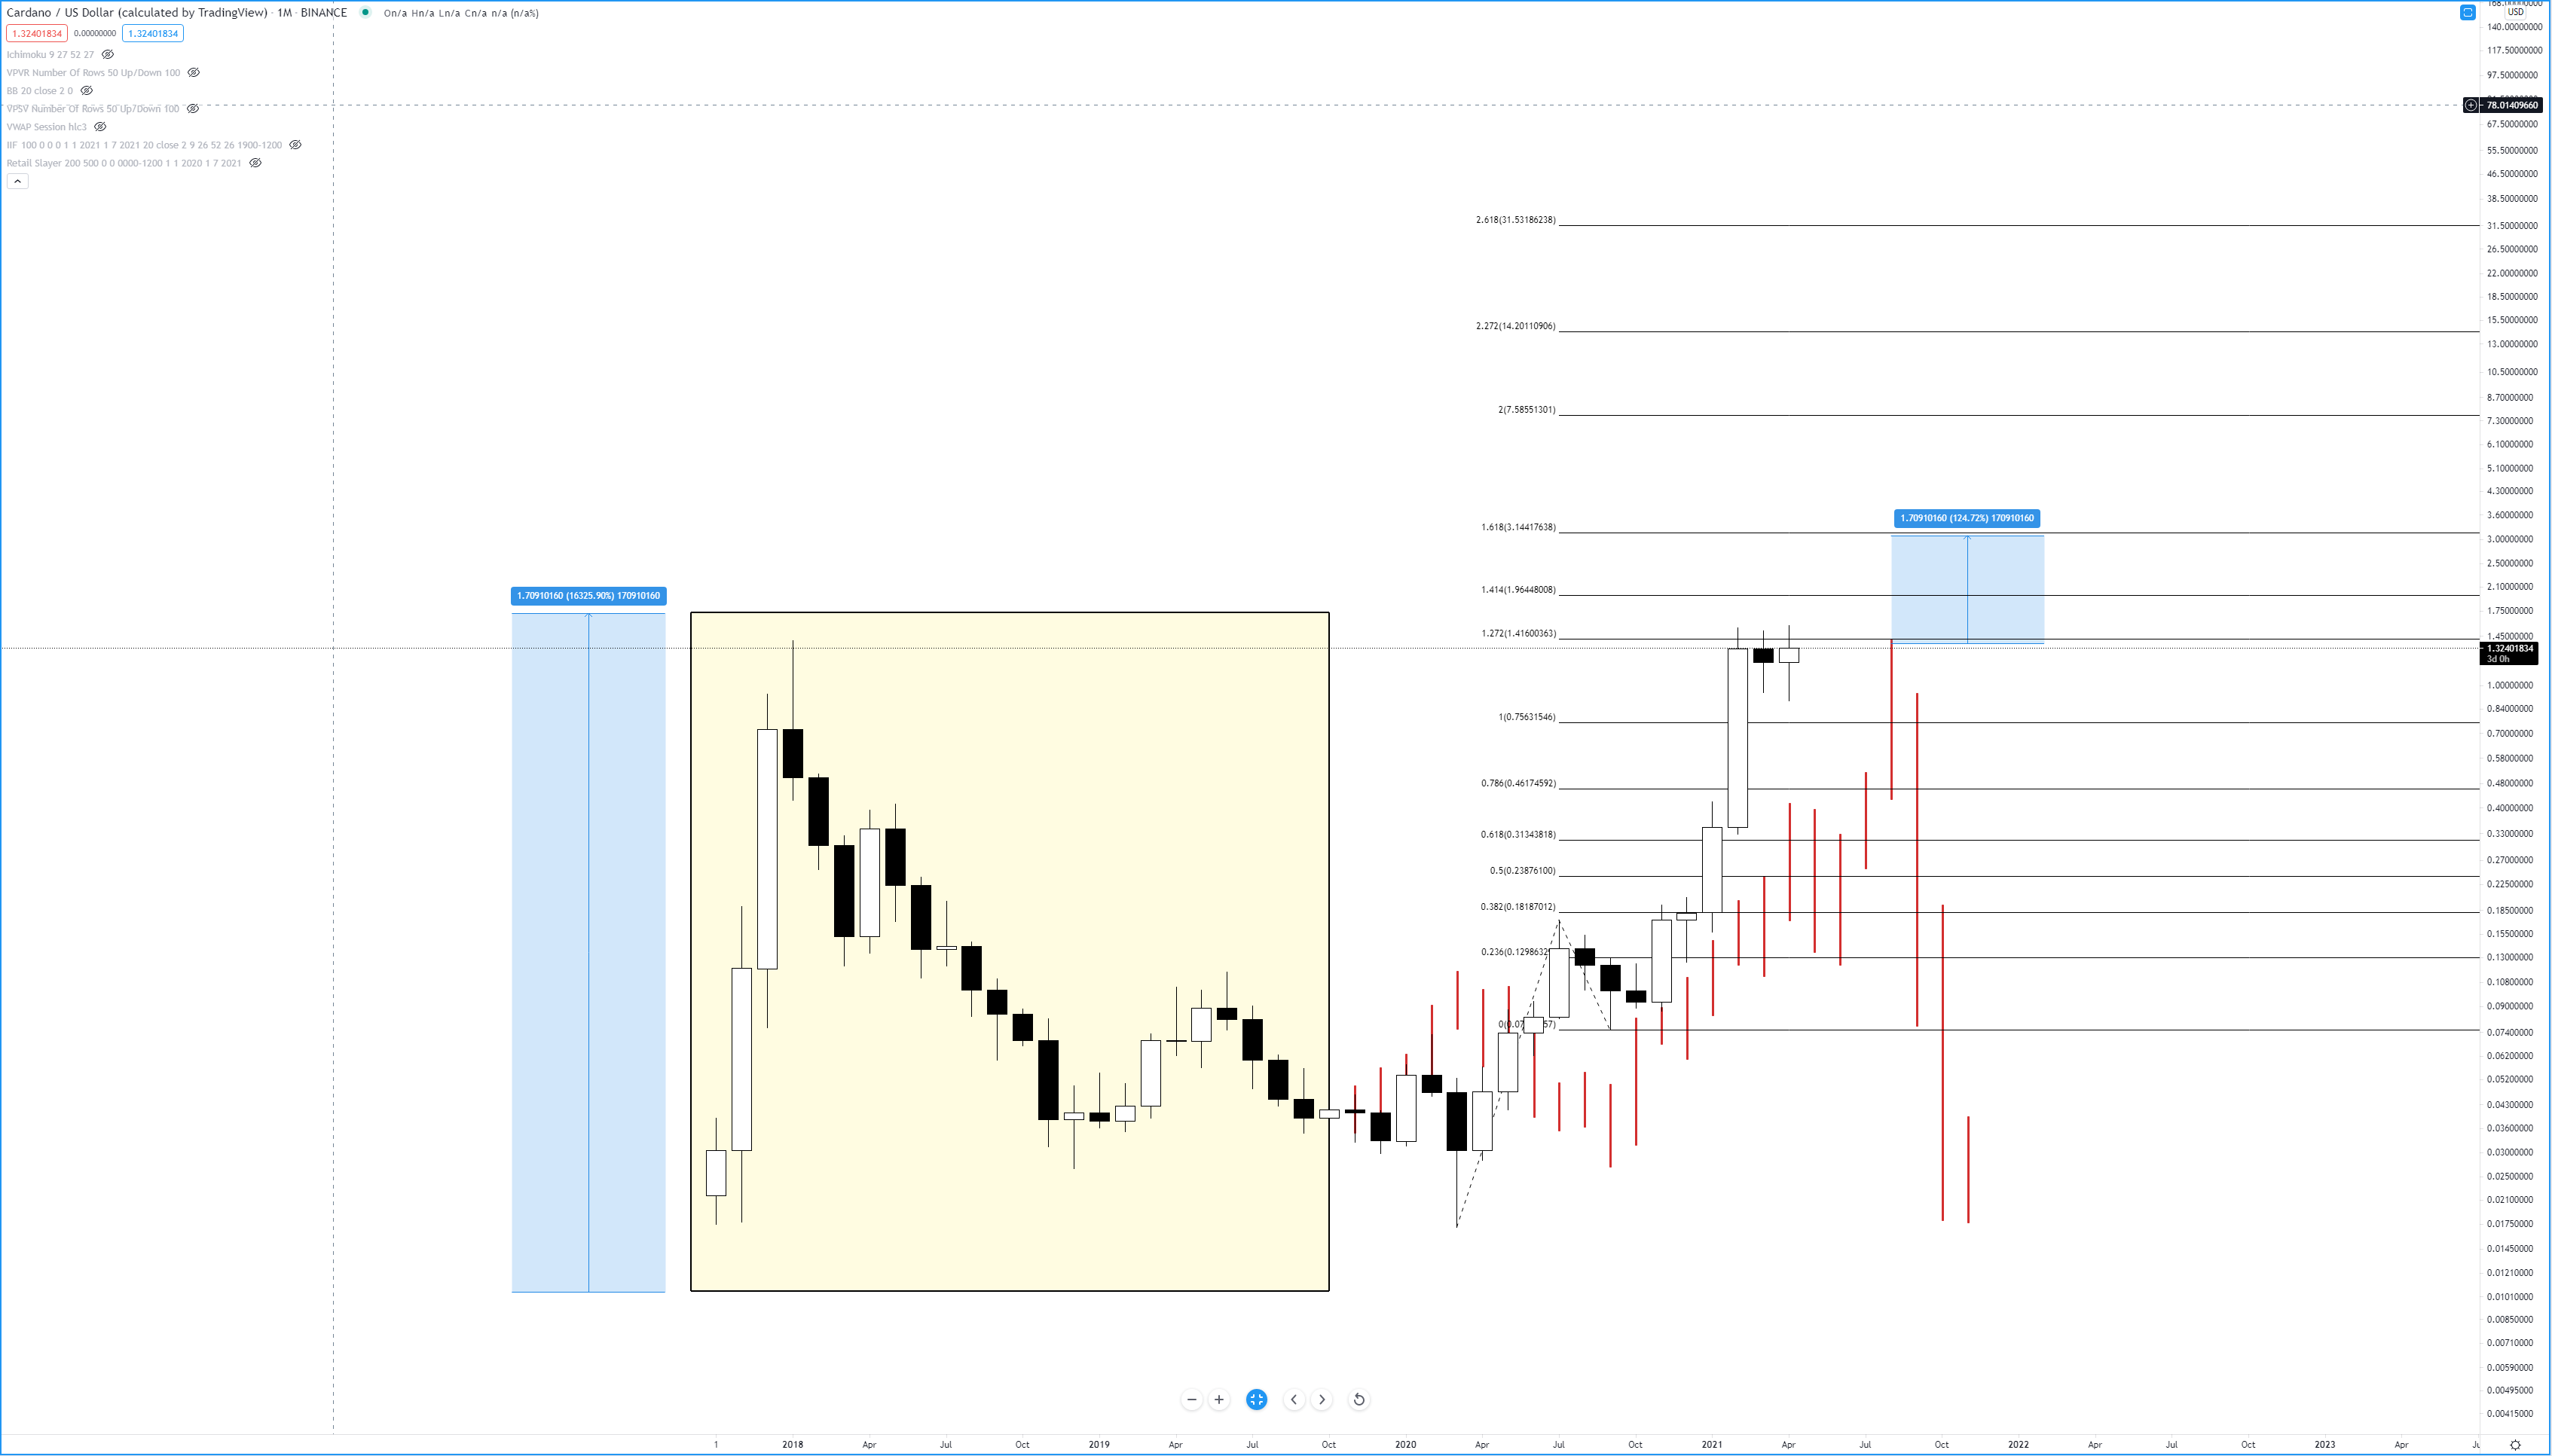
Above: Cardano (ADAUSD) Monthly Chart
I am going to utilize the same methods from Litecoin’s analysis on Cardano’s. The highlighted price range in yellow represents the foldback pattern represented with the red hash marks. Just like Litecoin, I don’t expect to see Cardano experience the next swing move lower, but instead do the mirrored foldback direction and trade higher. With Cardano’s chart we need to measure the rise from the beginning of its chart to the prior all-time a high a little differently than we did with Litecoin. Instead of copying 16,000% move, I maintained the relative and proportional range by dragging the zone to our current trading range. That puts Cardano at a very interesting price level – the $3.00 value area. It makes sense, to me, that we would observe this area to be the next major high. In the video analysis I did yesterday and today, I pointed out the daily and weekly extension levels appear to create a confluence near the $2.618 value area – don’t confuse with the 2.618 Fibonacci level (crazy how that works). On the monthly chart above, I drew a Fibonacci extension from the all-time low in last March, to the July 2020 swing high and then to our last major swing low in September 2020. The 1.618 Fibonacci extension from the levels brings Cardano to 3.144 – the next likely major high. If I were a position trader, I’d be all over this setup in anticipation of a likely move over the next few months towards that $3 range.
Advertisement
Save money on your currency transfers with TorFX, voted International Money Transfer Provider of the Year 2016 – 2020. Their goal is to connect clients with ultra competitive exchange rates and a uniquely dedicated service whether they choose to trade online or over the telephone.
Find out more here.


