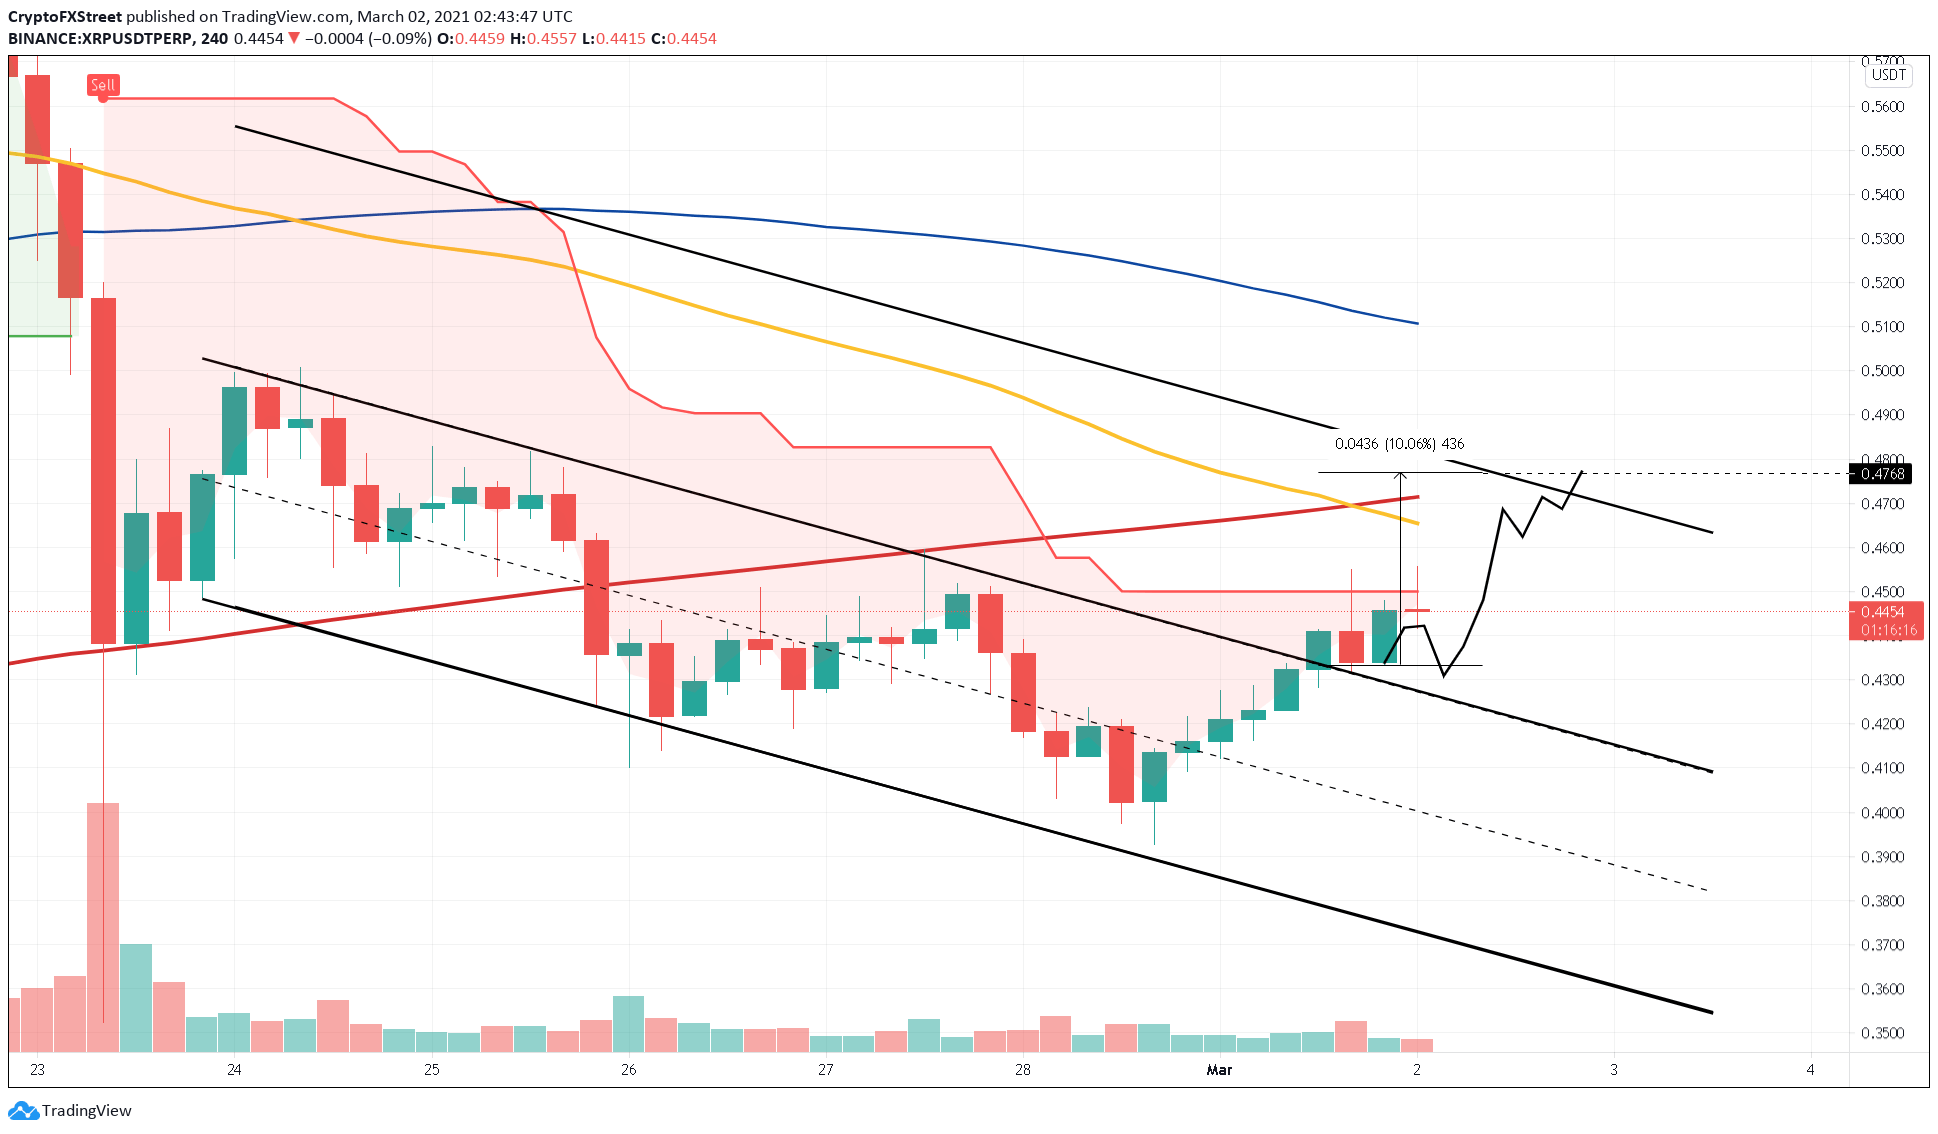
- XRP price broke out of a descending parallel channel indicating a bull rally.
- If the bullish momentum continues, Ripple price could surge another 5% to 10%.
- A bearish scenario will come into the picture if XRP slices through the parallel channel’s lower trendline at $0.42.
XRP price saw a 46% downswing between February 22 and 23. Since then, XRP has slid into a consolidation with its last leg resulting in a 16% bull rally in under 30 hours.
XRP price eyes for a higher high
XRP price found support on the 200 four-hour moving average (MA) after the market crash on February 22. Soon thereafter, XRP began consolidating in a series of lower highs and lower lows. Connecting these swing highs and swing lows results in a descending parallel channel. The breakout from this technical pattern is bullish, and the target is determined by adding the height of the channel to the breakout point at $0.43. This target puts XRP at $0.47.
The remittances token broke out of the bullish setup on March 1 and still has a 5% to 10% upswing left to hit its intended target.
XRP/USDT 4-hour chart
While the future certainly seems bullish for XRP, other technical aspects suggest that this bull rally will not be a cakewalk.

XRP/USDT 4-hour chart
The first resistance barrier is the SuperTrend indicator’s sell-signal that was flashed on February 23. This supply barrier stands at $0.45. After this, XRP price needs to slice through the 50 four-hour MA, which slid below the 200 four-hour MA indicating a bearish crossover on March 1.
So, investors need to note that the XRP price journey is sprinkled with multiple barriers that could prevent its upswing. Only a four-hour candlestick close below the breakout point at $0.43 will invalidate the bullish outlook.
In this case, XRP will head towards the lower trendline at $0.36, which is a 16% drop.
