- Bitcoin jumpstarts the uptrend after support at $43,000 and a technical pattern breakout.
- Ethereum leads recovery among the altcoins, aiming for the resistance at $1,650.
- Ripple is pivotal at the 23.6% Fibonacci level on the 4-hour chart.
The weekend session was not yielding for many cryptocurrencies, including Bitcoin, Ethereum, and Ripple. Besides, the majority of the cryptoasset spiraled further, continuing with last week’s bearish impulses.
Bitcoin failed to hold above the support at $45,000 and extended the bearish leg to $43,000. The largest altcoin, Ethereum, sliced through the support at $1,400 and explored the levels marginally below $1,300. On the other hand, XRP revisited the support at $0.4 before renewing the uptrend toward $0.5.
The rest of the cryptocurrency market is flipping bullish, particularly led by altcoins such as Binance Coin (up 19%), Aave (up 20%), Solana (up 19%), Maker up (18%), Fantom (up 32%) and Ravencoin (up 20%).
Bitcoin breakout aims for $54,000
Bitcoin is nurturing an uptrend after the formation of a falling wedge pattern on the 4-hour chart. The bullish pattern comes into the picture when an asset’s persistent downtrend nears the end. It is created using two trendlines connecting consecutive declining peaks and a series of lower lows.
As the price nears the pattern’s apex, the volume reduces, limiting the bears’ effort. At the same time, buyers get ready to take control. A breakout usually happens before the trendline meet.
Bitcoin has already broken above the upper trendline, validating a 16% upswing to $54,000. This bullish outlook has been reinforced by the Moving Average Convergence Divergence (MACD), recently flipped bullishly.
BTC/USD 4-hour chart
It is worth mentioning that resistance is expected at the 100 Simple Moving Average (SMA), currently at $49,440, and the 50 SMA holding at $50,000. If bulls fail to break above this level, a correction may take precedence toward $43,000.
Ethereum primed for a 15% breakout
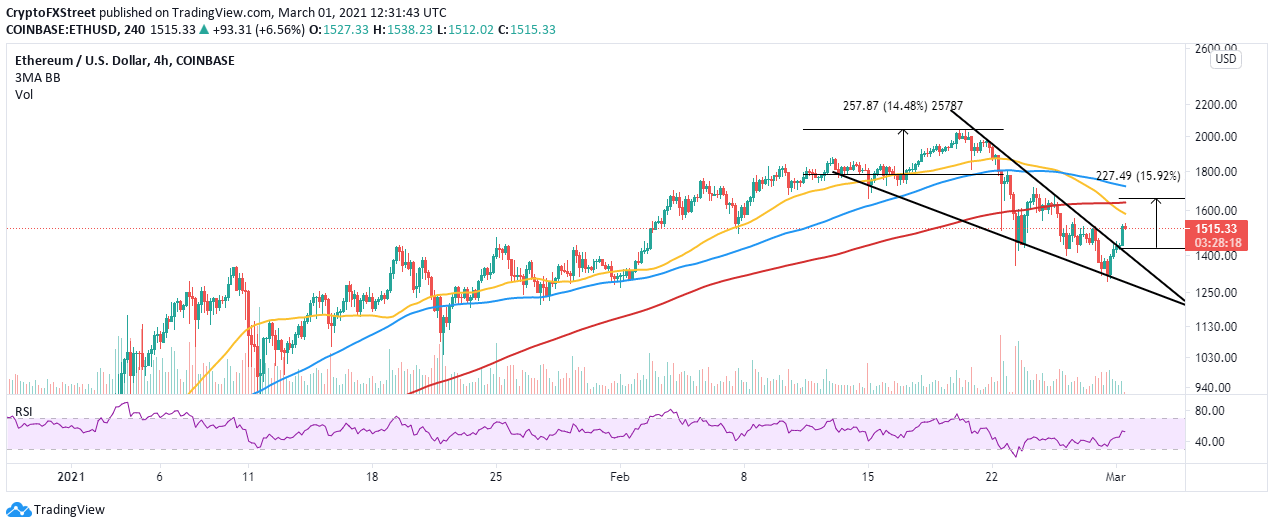
Ethereum has formed the same falling wedge pattern as Bitcoin, pointing at a 15% upswing to 1,650. At the time of writing, Ether is exchanging hands at $1,522 as bulls challenge the overhead pressure at $1,530.
The Relative Strength Index (RSI) reveals that the trend is in the bulls’ hands after stepping above the midline. Moving closer to the overbought area may trigger more buy orders, perhaps create enough volume for gains eyeing $2,000. On the upside, a bullish signal will be to trade beyond $1,530 (immediate resistance) and extending the up leg past $1,600.
ETH/USD 4-hour chart
On the other hand, it is essential to keep in mind that Ethereum must establish support above $1,500 to avoid potential losses. On the downside, the next tentative support is $1,400, but if the bearish leg stretches, ETH will retest $1,200.
Ripple flirts with the 23.6% Fibonacci
The cross-border token deals with the resistance at the 23.6% Fibonacci retracement level following a rebound from $0.4. Trading beyond this zone leaves XRP with open-air to explore toward the critical hurdle at $0.47, a confluence highlighted by the 38.2% Fibo, the 200 SMA, and the 100 SMA.
The MACD cements XRP’s gradual bullish momentum as it moves closer to the mean line. Besides, the MACD line (blue) has crossed above the signal line, signaling a bullish impulse.
XRP/USD 4-hour chart
Ripple will abandon the bullish narrative if the resistance at the 23.6% Fibo fails to give way. Closing the day under this zone could open the Pandora box as massive sell orders are triggered. Testing the support at $0.4 again could pave the way for another downswing, eyeing $0.35 and $0.3, respectively.


%20-%202021-03-01T155148.239-637502004652038738.png)