
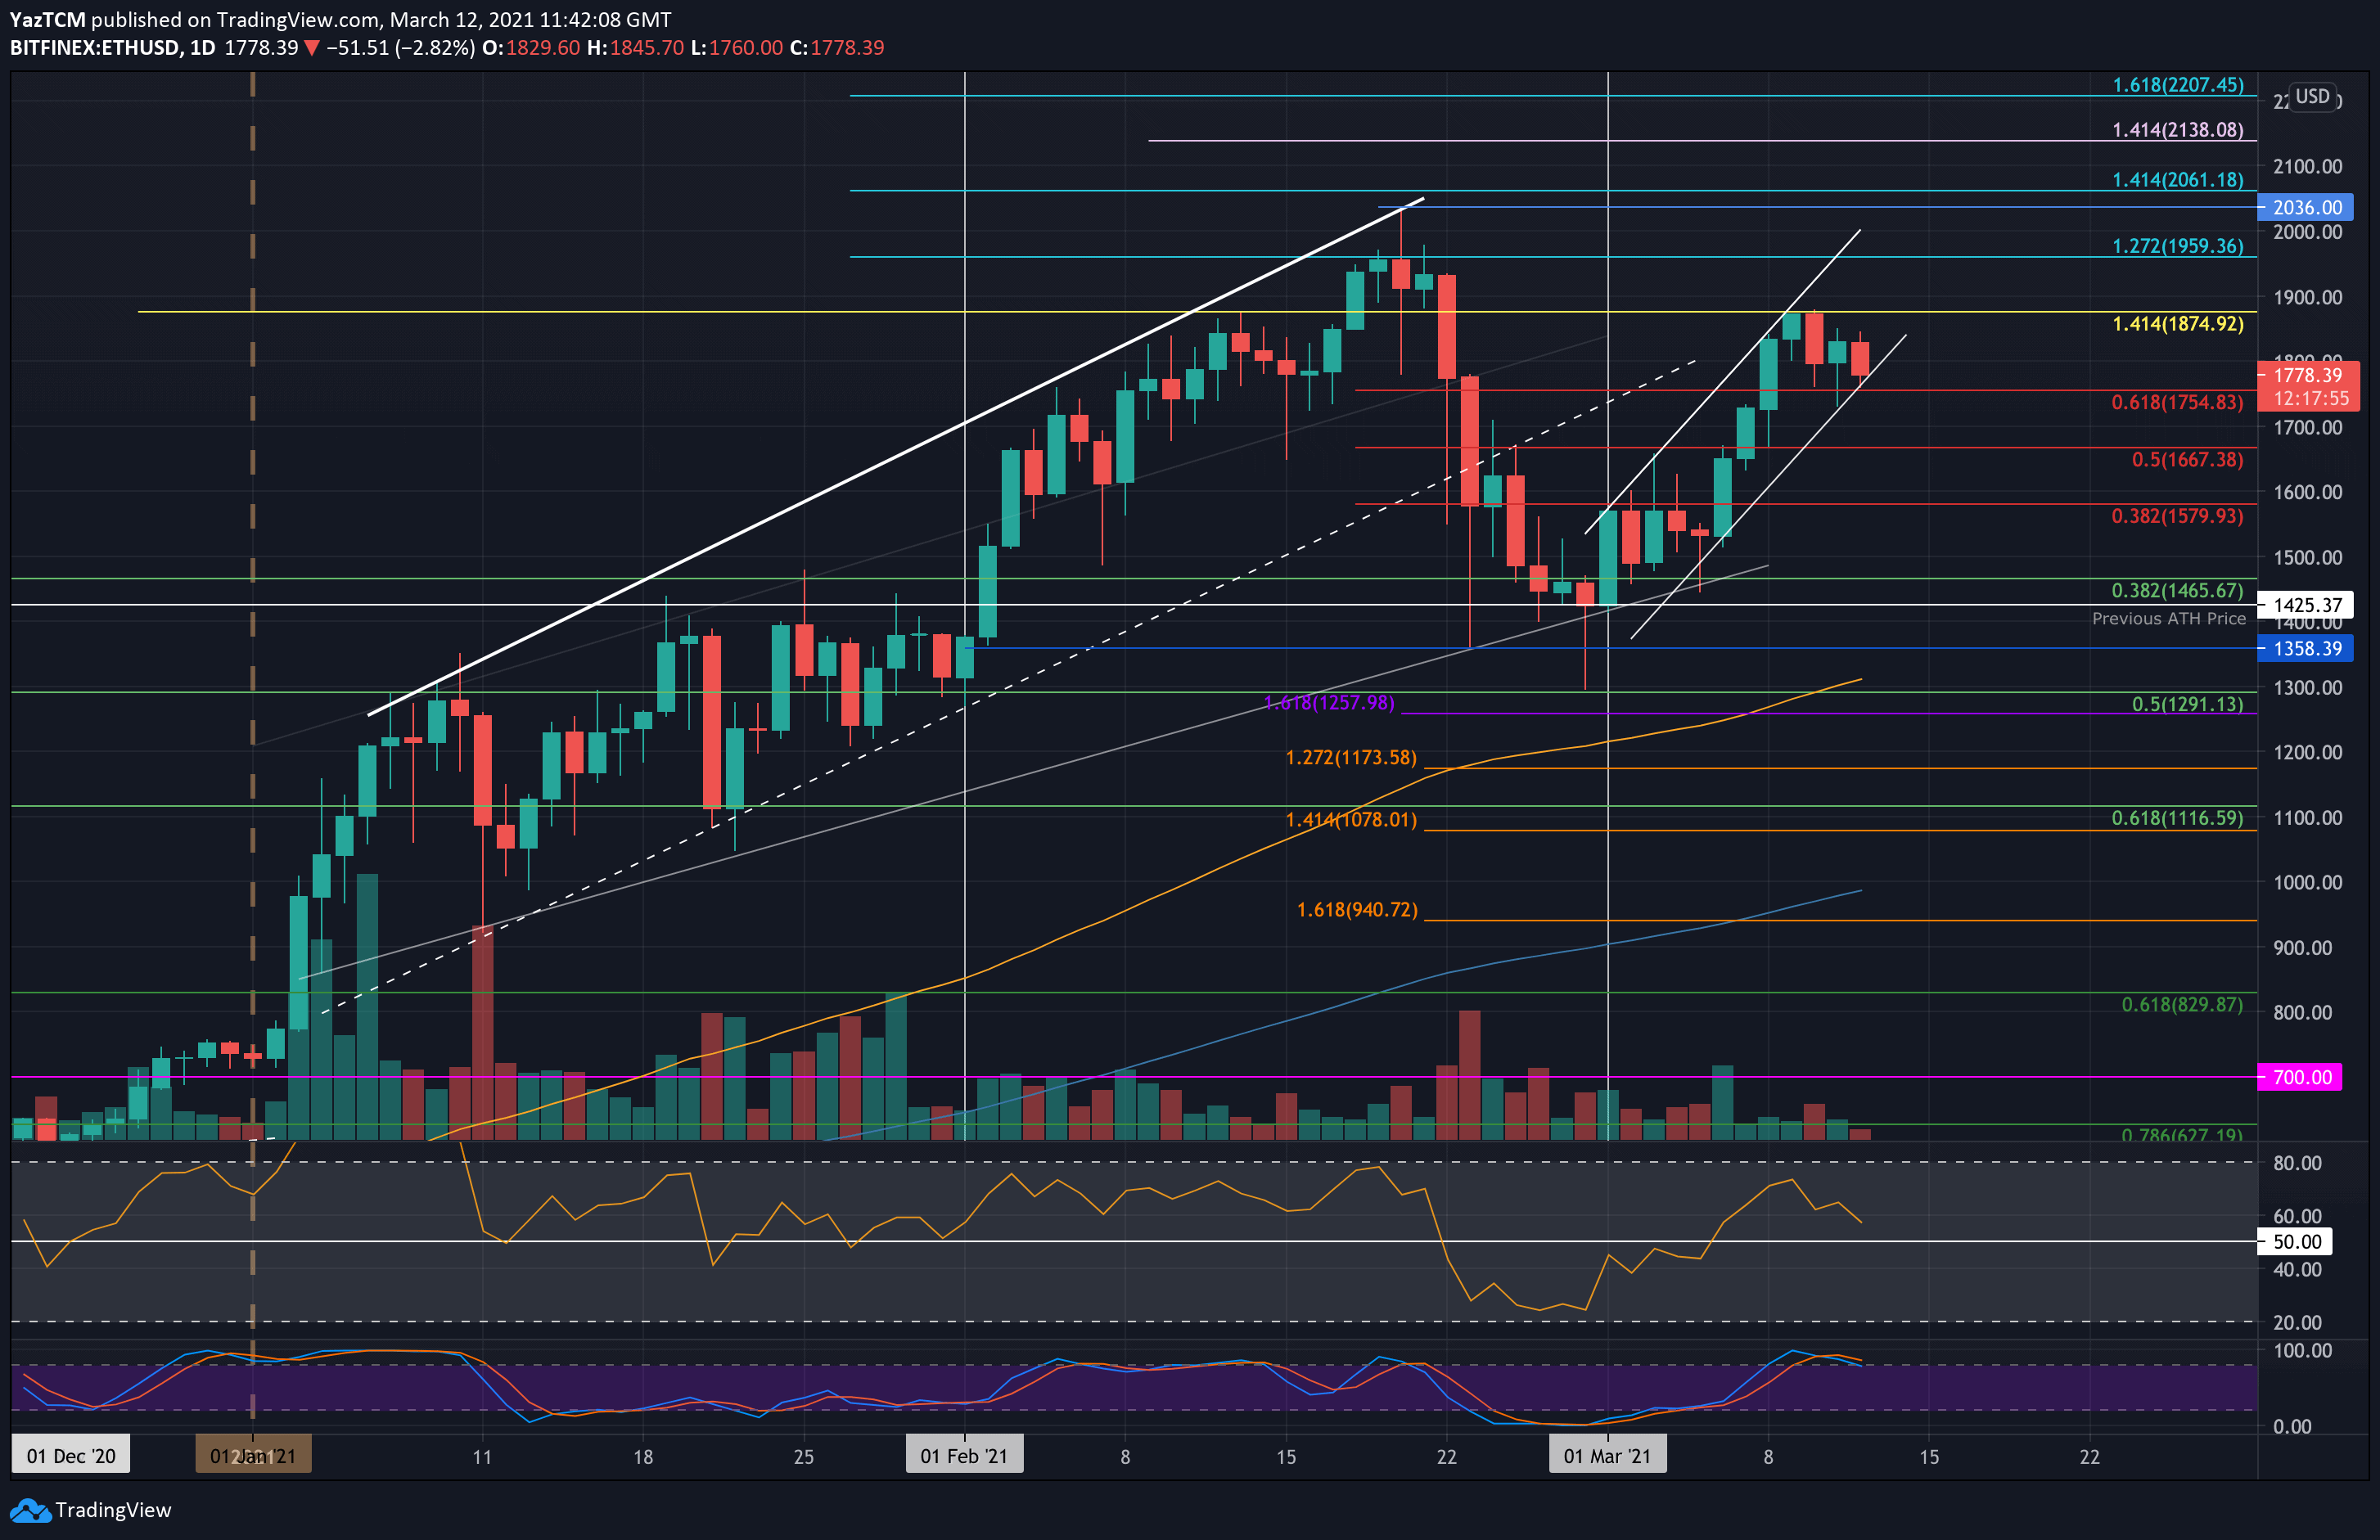
ETH/USD – Market Falls Into Lower Boundary of Ascending Price Channel
Key Support Levels: $1755, $1700, $1667.
Key Resistance Levels: $1876, $1900, $1960.
Ethereum started the week on a bullish note after rebounding above $1500 over the weekend. The cryptocurrency went on to form a short-term ascending price channel as it continued to push upward to reach the resistance at $1875 (1.414 Fib Extension).
It could not close a daily candle above the resistance and ended up rolling over on Wednesday. It has since found support at $1755 (previous resistance) and is now trading at the lower boundary of the ascending price channel.
ETH-USD Short Term Price Prediction
Looking ahead, the first level of support lies directly at $1755 (lower boundary of the price channel). This is followed by support at $1700, $1667 (previous resistance), $1580, and $1500.
On the other side, the first level of strong resistance lies at $1876 (1.414 Fib Extension – yellow). This is followed by $1900, $1960 (1.272 Fib Extension – blue), $2000, and $2036 (ATH).
The RSI is heading lower, indicating fading bullish momentum. It is still well above the midline, so the bears are not taking over the momentum anytime soon.
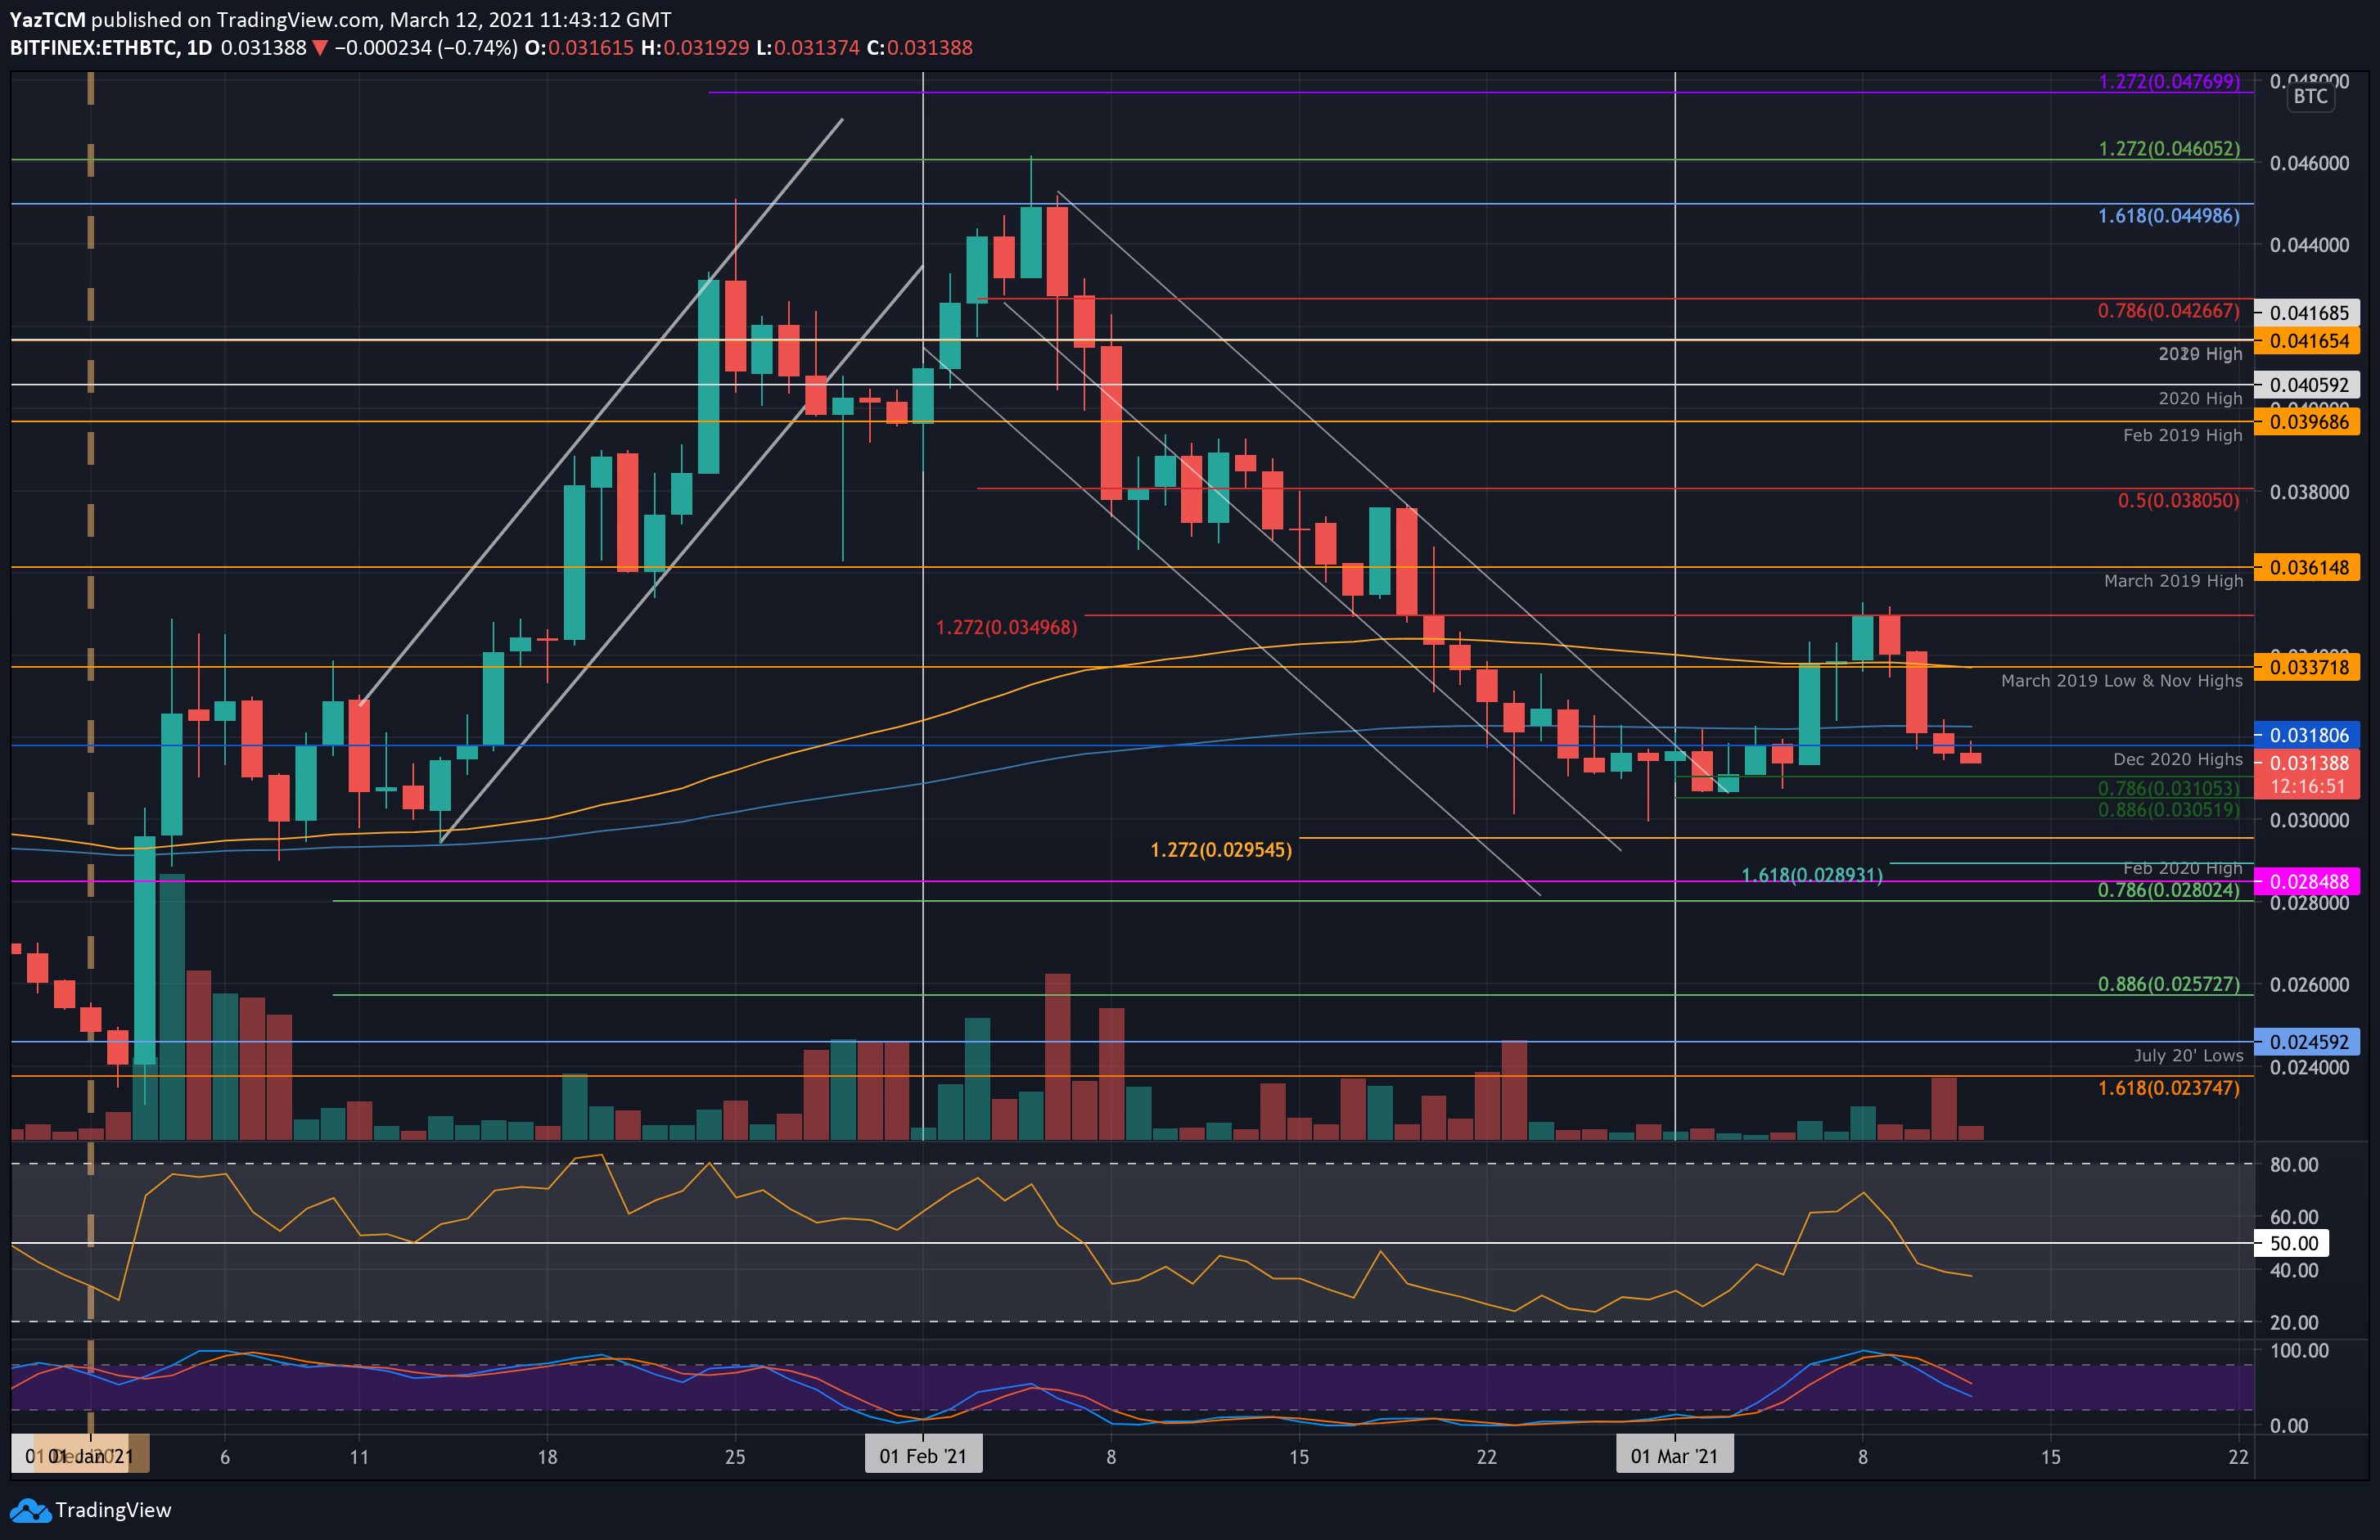
ETH/BTC – Bears Push Beneath December 2020 Highs
Key Support Levels: 0.031 BTC, 0.0305 BTC, 0.03 BTC.
Key Resistance Levels: 0.0318 BTC, 0.032 BTC, 0.0337 BTC.
Against Bitcoin, ETH had also started the week positively as it pushed above the 100-day EMA at 0.0337 BTC to reach the resistance at 0.035 BTC. Unfortunately, it was unable to break above and ended up rolling over from there on Tuesday.
The coin fell lower as it broke beneath the 100-days and 200-day EMAs on Wednesday. Yesterday, it continued beneath the December 2020 highs at 0.0318 BTC to reach 0.0313 BTC today.
ETH-BTC Short Term Price Prediction
Looking ahead, the first level of support lies at 0.031 BTC (.786 Fib). This is followed by 0.0305 BTC (.886 Fib), 0.03 BTC, and 0.0295 BTC (downside 1.272 Fib Extension).
On the other side, the first resistance lies at 0.0318 BTC (December 2020 Highs). This is followed by 0.032 BTC (200-days EMA), 0.0337 BTC (100-days EMA), and 0.035 BTC (weekly high).
The RSI is in the bearish territory as it sinks beneath the midline, indicating increased bearish momentum. It would need to start reversing to indicate that the bearish momentum is finally beginning to fade.
PrimeXBT Special Offer: Use this link to register & enter CRYPTOPOTATO35 code to get 35% free bonus on any deposit up to 1 BTC.
Disclaimer: Information found on CryptoPotato is those of writers quoted. It does not represent the opinions of CryptoPotato on whether to buy, sell, or hold any investments. You are advised to conduct your own research before making any investment decisions. Use provided information at your own risk. See Disclaimer for more information.
Cryptocurrency charts by TradingView.