- Bitcoin stalled short of $58,000, giving bears leeway to launch an assault on the support at $54,000.
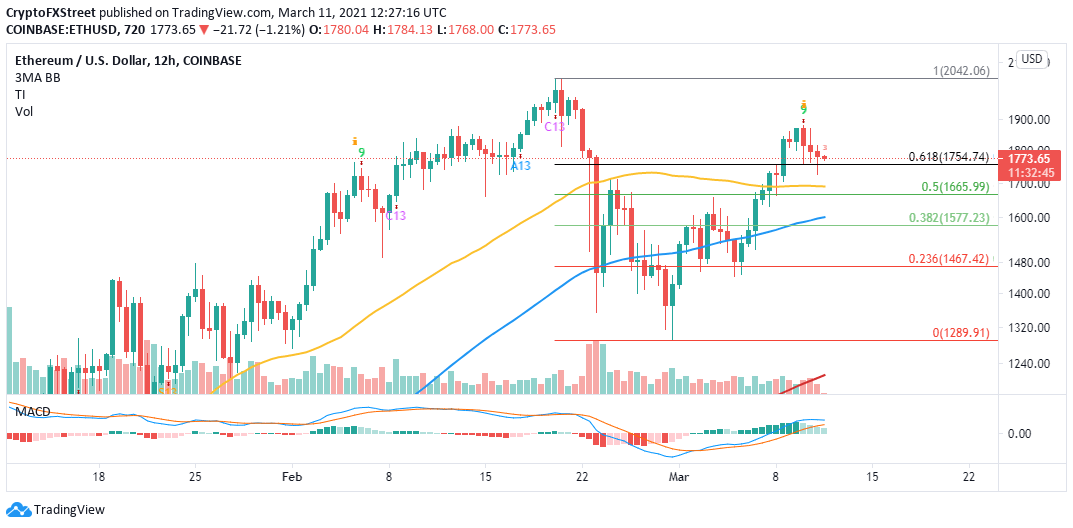
- Ethereum remains vulnerable to losses after the TD Sequential indicator flashed a sell signal.
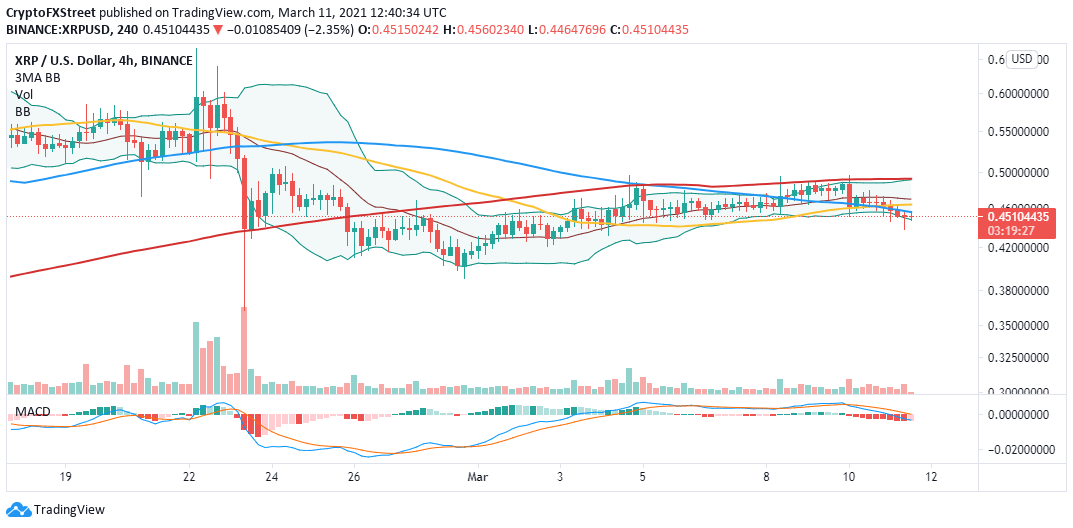
- Ripple is looking toward a potential breakdown to $0.4 following the extended consolidation.
The cryptocurrency market is relatively quiet towards the end of the European session on Thursday. Bitcoin is displaying some semblance of stability after the rejection from highs above $57,000. Ethereum struggles to reclaim the ground above $1,800 while Ripple is pivotal at $0.45.
Intriguingly, some altcoins are performing incredibly well amid the broad-based lethargic price action. For instance, THETA is up 25% over the last 24 hours. Hedera Hashgraph went ballistic, posting 26% gains, while Theta Fuel is up a whopping 71%.
Bitcoin meets obstacles on the way to all-time highs
The bellwether cryptocurrency has barely made progress on Thursday, trading 0.16% above the opening value. However, at least 13% in gains has been accrued over the last seven days. On the upside, Bitcoin hit a barrier at $57,545 and corrected to confirm support slightly above $53,000.
At the time of writing, Bitcoin has recovered above $56,000 but seems to be having an uphill battle sustaining the uptrend to $58,000. A sell signal has been presented on the 4-hour chart by the TD Sequential Indicator. The sell signal manifested in a green nine candlestick. If validated, Bitcoin may drop in one to four candles on the 4-hour chart.
Besides, the Relative Strength Index (RSI) has stalled marginally under the overbought region. Note that losing support at $54,000 would trigger market instability and volatility. Other key support levels to keep in mind include $52,000 and $48,000.
BTC/USD 4-hour chart
Ethereum bulls continue to lose grip as losses linger
Ethereum, like Bitcoin, is facing multiple sell signals after the uptrend from the beginning of the week lost steam short of $1,900. Support at $1,800 failed to hold, leaving ETH with open-air to explore. The TD Sequential indicator flashed a sell signal on the 4-hour chart, adding credence to the bearish outlook.
Meanwhile, the pioneer altcoin is seeking another anchor at the 61.8% Fibonacci retracement level. Losses under this level would be detrimental to the gains accrued in the last few days. Ether will likely continue with the downswing to the 50 Simple Moving Average (SMA) on the 4-hour chart, where bulls could take a pit stop. If push comes to shove, we can expect Ethereum to seek refuge at $1,600, as highlighted by the 38.2% Fibo.
ETH/USD 4-hour chart
Ripple is on the brink of a breakdown
XRP has been in consolidation for almost three weeks. Recently a potential breakout was canceled at the 200 SMA on the 4-hour chart. On the downside, Ripple is holding to the support at $0.45.
The Bollinger Bands confirm the consolidation and suggest that the cross-border cryptocurrency is nearing a breakdown. Closing the day below the middle boundary added weight to the overhead pressure.
In the meantime, XRP’s immediate upside has been limited by the 100 SMA. The Moving Average Convergence Divergence (MACD) has also endorsed the imminent breakdown. Closing the day under $0.45 could trigger selling orders as volatility returns to the market. Support is anticipated at $0.4 and $0.35.
XRP/USD 4-hour chart
Recovery to $0.5 will only be possible if Ripple closes the day above $0.45 and steps beyond the 100 SMA. Action past $0.46 would call out more buyers to join the market and push the gains toward $0.6.


