- Chicago-based Cboe exchange expressed interest in Bitcoin two years after shutting down BTC futures.
- The bellwether cryptocurrency could drop significantly if short-term support at $51,500 breaks.
- Ethereum faces uphill battle at the 50% Fibonacci level on the 4-hour chart.
- Ripple rejected from resistance at $0.5 amid deteriorating technical levels.
The cryptocurrency market is wading in red waters for the second day in a row. The widespread declines are likely to have been triggered by Bitcoin’s drop from highs around $60,000 to $51,000.
Some of the most affected crypto assets include Polkadot (down 13%), Uniswap (down 13.5%), THETA (down 11%), IOTA (down 10%) and Theta Fuel (down 18%). Intriguingly, some altcoins are holding in the green, such as Pundi X (up 26%), BitTorrent (up 5%), and Filecoin (up 10%).
Institutional and retail demand for Bitcoin is growing
The Cboe Global Markets Inc., through its Chief Executive Officer Ed Tilly, reckons interest in Bitcoin and other cryptocurrency products is growing. The Chicago-based exchange shut down its Bitcoin futures product two years ago but eyes another comeback due to the demand from institutions and retail investors. Till told Bloomberg via a phone call:
We’re still interested in the space; we haven’t given up on it.
We’re keen on building out the entire platform. There’s a lot of demand from retail and institutions, and we need to be there.
Meanwhile, Bitcoin struggles to sustain price action above $52,000. Its immediate upside is limited by the 200 Simple Moving Average (SMA) on the 4-hour chart. If support at $51,500 is shattered, the bellwether cryptocurrency may freefall under $50,000 and extend the bearish leg to $46,000.
The Moving Average Convergence Divergence (MACD) indicator has a bearish impulse. The MACD line (blue) crossed below the signal line, adding credibility to the pessimistic outlook.
BTC/USD 4-hour chart
Ethereum rebounds from key support
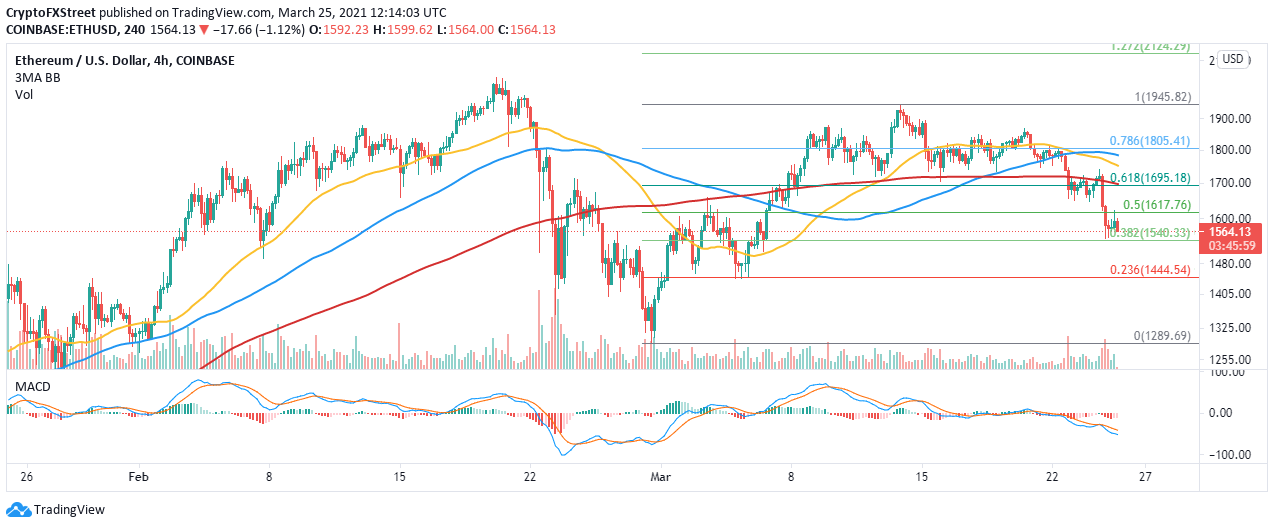
Ether is trading marginally under $1,600 amid the bulls’ persistent push to sustain the uptrend toward $2,000. Immediate resistance at the 50% Fibonacci level must come down and validate the rest of the journey. In the meantime, support at $1,540, highlighted by the 38.2% Fibo, must also hold to ensure market stability. This will allow bulls to shift their attention to other critical levels, such as the 200 SMA at $1,700, the seller congestion at $1,800 and $2,000, respectively.
ETH/USD 4-hour chart
The MACD is sloping downward under the midline, thus cementing the bears’ grip over the price. As long as the MACD line’s divergence from the signal line widens, Ethereum will be inclined to the bearish side. Therefore, further declines are likely, especially if support at $1,540 fails to hold.
Ripple bearish impulse toughens
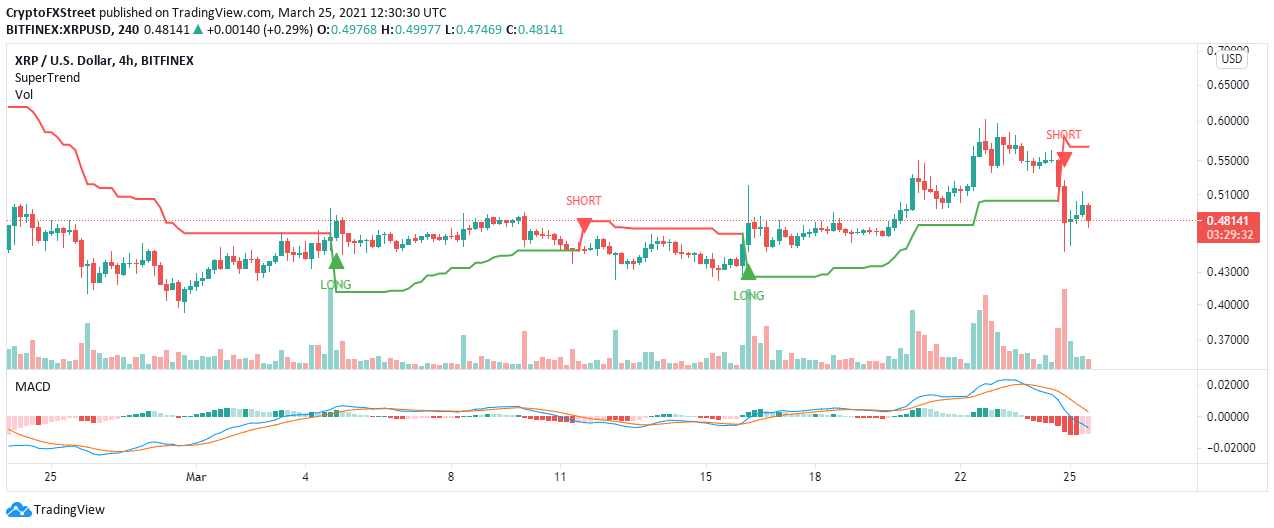
The 4-hour SuperTrend indicator recently presented a call to short Ripple. A dip followed this signal to $0.45. The indicator usually suggests the general trend of an asset to traders.
A signal to short XRP manifested in the indicator flipping above the price and turning its color from green to red. In other words, losses are most likely to continue in the near term.
A comprehensive look at the 4-hour chart shows the MACD’s vivid bearish picture, confirming the gloomy outlook.
XRP/USD 4-hour chart
It is worth noting that support at $0.45 remains key to the uptrend. Buyers will build another attack mission from here while targeting an upswing above $0.5 and toward $0.6.


