- Litecoin price had a significant breakout from a descending triangle pattern.
- The digital asset re-tested the previous resistance level and has resumed its uptrend towards $200.
- LTC faces practically no barriers on the way up as bulls hold all the momentum.
Litecoin had a major breakout from a descending triangle pattern on the 4-hour chart with a price target of $185. After a small drop towards the previous resistance trendline, LTC bulls quickly bought the dip and have pushed Litecoin price up to $154.
Litecoin price faces no significant barriers on the way up
The initial breakout took Litecoin price up to $158.68 and the digital asset is currently trading at $154. Climbing above $158.68 is bound to push LTC towards its initial price target of $185 and the psychological level of $200.
LTC/USD 4-hour chart
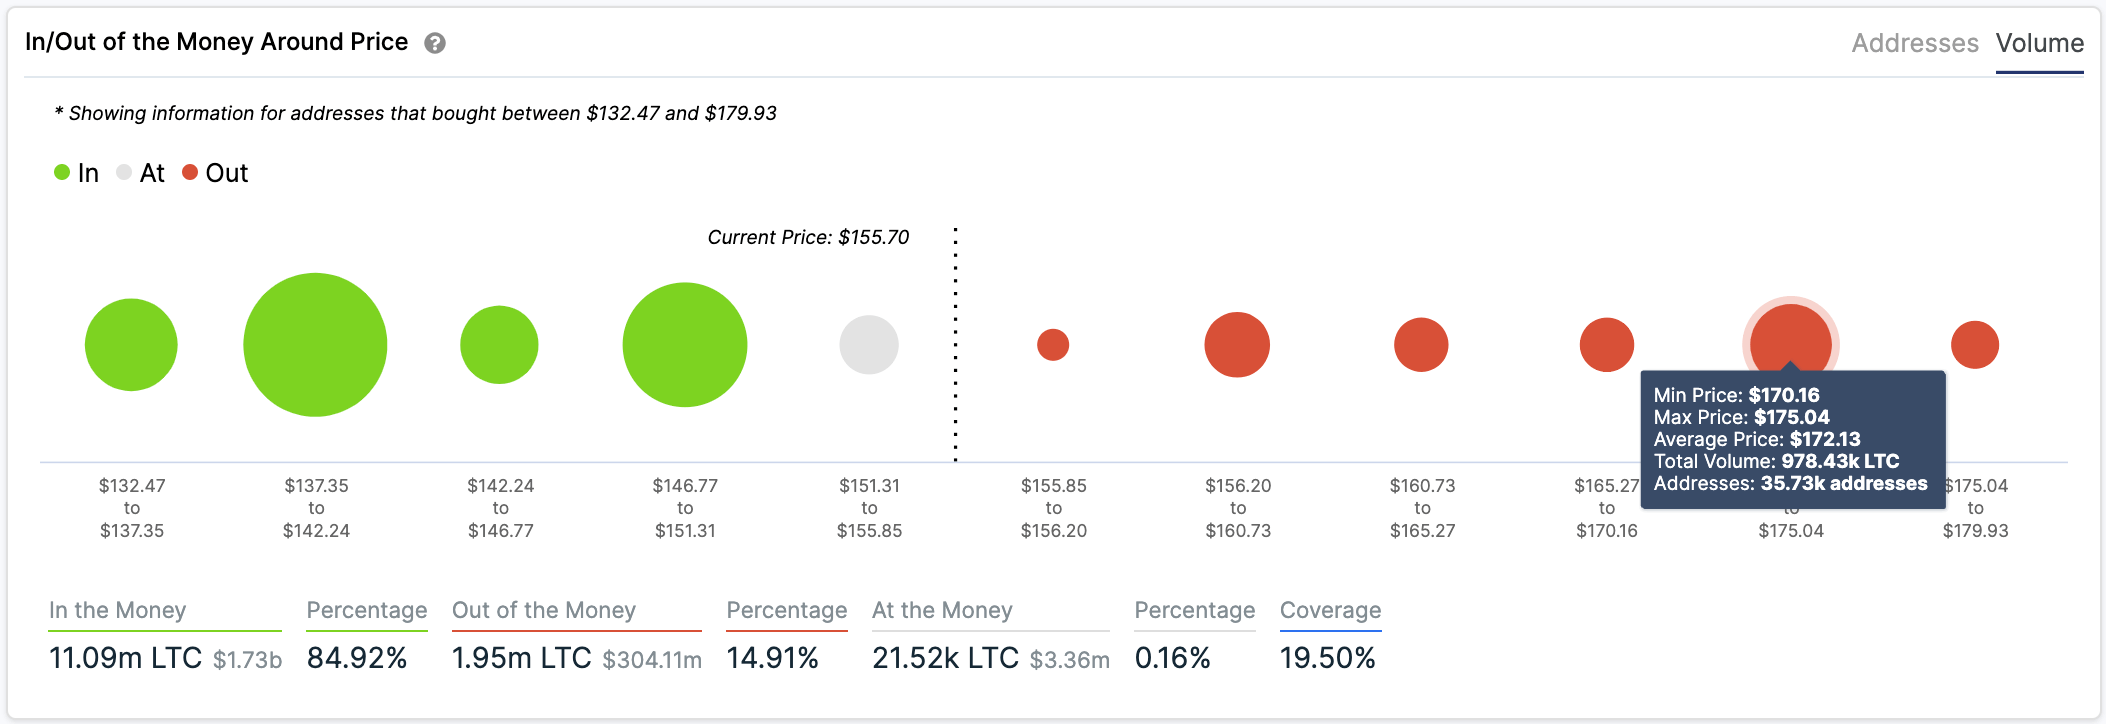
The In/Out of the Money Around Price (IOMAP) chart shows practically no resistance above $155. The most significant resistance area is located between $170 and $175 with close to 1 million LTC in volume from 35,000 addresses.
LTC IOMAP chart
Additionally, the number of whales holding at least 10,000 LTC coins has increased significantly over the past month from a low of 512 on December 27, 2020 to 527 currently. This metric shows that large holders have been accumulating Litecoin for the past month and continue doing so.
LTC Holders Distribution chart
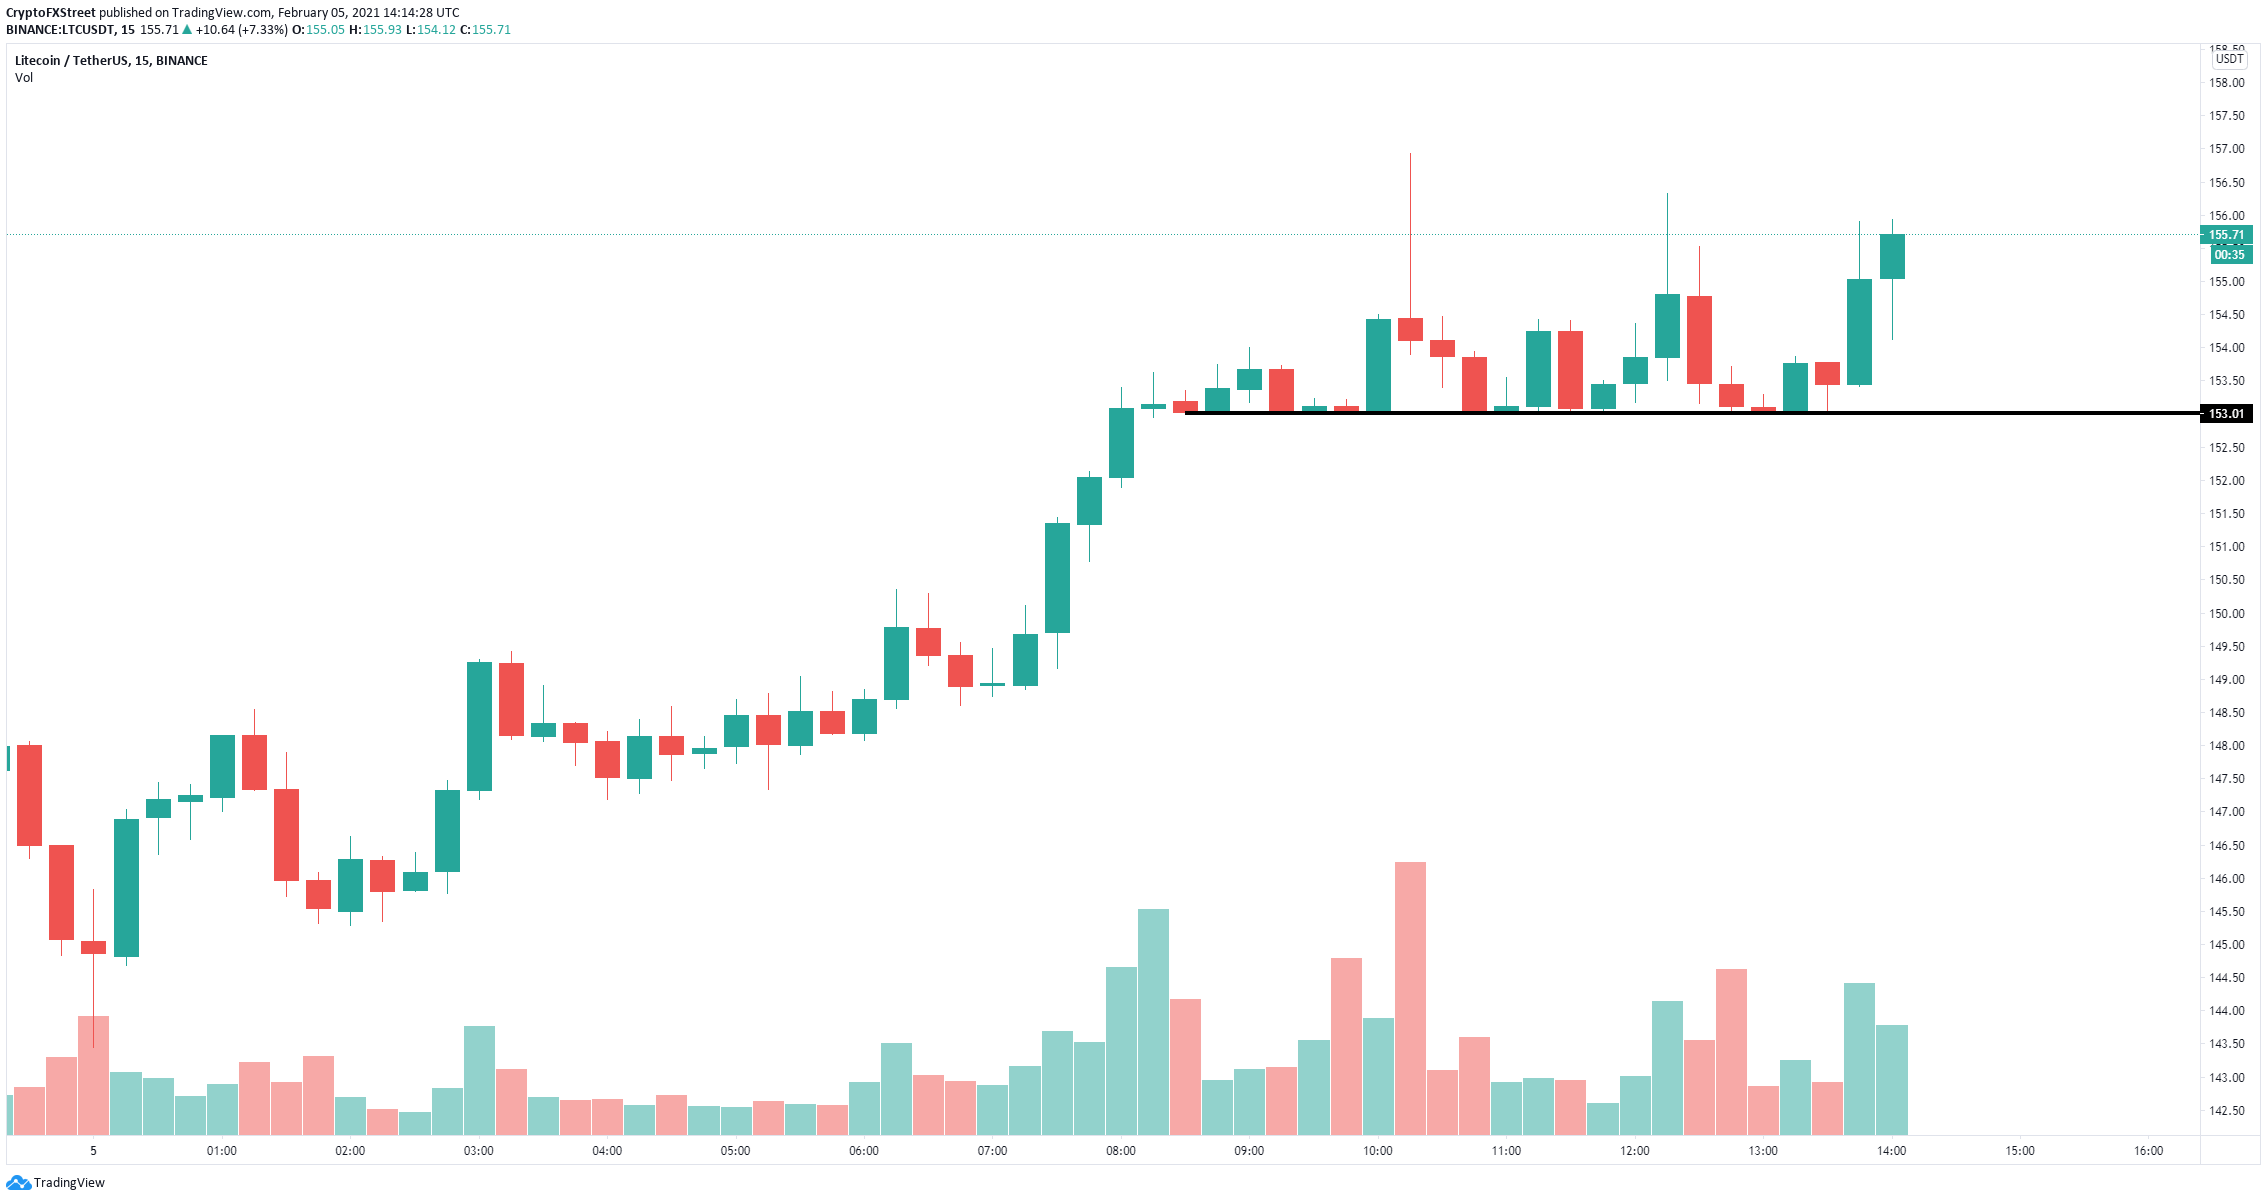
However, on the 15-minute chart, Litecoin has established a crucial support level at $153 in the short-term and it’s having a lot of trouble climbing above $156.
LTC/USD 15-minute chart
Another rejection from $156 would quickly push Litecoin price down to $153. Losing this critical support level will drive LTC down to $149 in the short-term.


%20[15.07.11,%2005%20Feb,%202021]-637481314141059396.png)
