- Bitcoin suffers rejection from $37,000, cutting short the anticipated rally to $40,000.
- Ethereum hits a new all-time high but risks a correction before it embarks on another uptrend.
- Ripple settles for consolidation between $0.35 and $0.4 after suffering a massive pump-and-dump action.
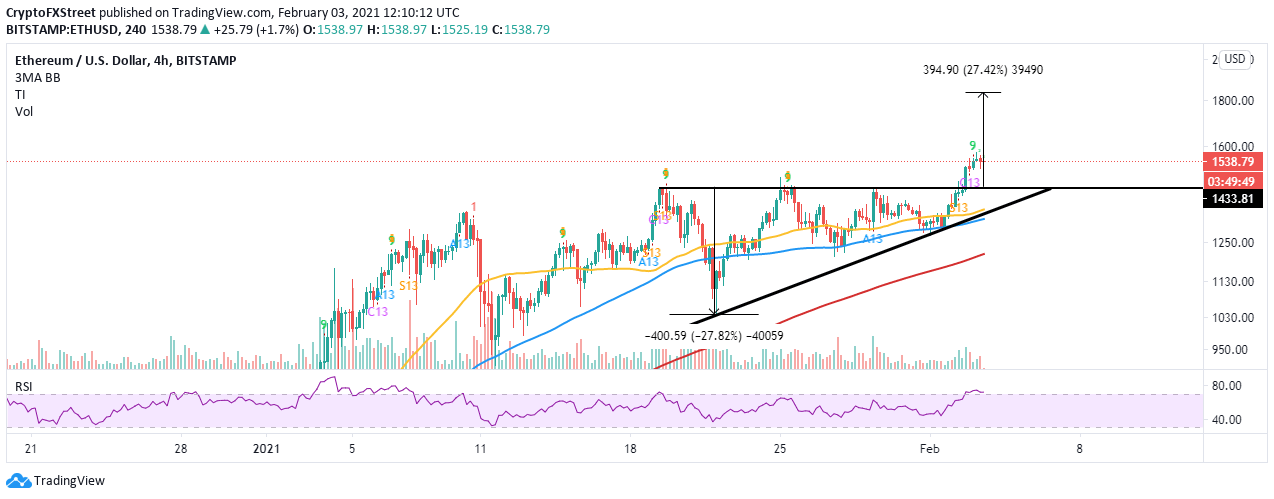
Ethereum roared to new all-time highs after stepping above $1,500. The breakout past this crucial level was a significant test for ETH and is likely to precede the rally towards $2,000.
Apart from the incredible movement in Ethereum, the cryptocurrency market has been relatively quiet over the last 24 hours. Ripple and Dogecoin are fighting for recovery after the pump-and-dump this week. Bitcoin has also cooled off after failing to rise above $37,000.
Bitcoin eyes another consolidation period ahead of breakout
The bellwether cryptocurrency soared above the former stubborn resistance at $34,000, as discussed on Tuesday. The bullish leg extended past $36,000 after stepping above the 200 Simple Moving Average on the 4-hour chart. However, bulls ran out of steam before dealing with the seller congestion at $37,000, a move that left the crucial $38,000 hurdle untested.
A correction is underway at the time of writing, but the Moving Average Convergence Divergence (MACD) suggests that it will not be substantial. This indicator tracks the trend of Bitcoin and measures its momentum.
The MACD line’s (blue) divergence from the signal line shows that buyers are relatively in control. Consolidation above the 200 SMA is critical to the uptrend’s continuation and would give buyers ample time to focus on higher levels at $38,000 and $40,000, respectively.
BTC/USD 4-hour chart
Ethereum takes a breather above $1,500
ETH is exchanging hands at $1,540, moments after trading new record highs at $1,575. As covered recently, Ether is poised for a massive move upwards that could overshoot the ascending triangle breakout target at $1,800.
A conservative target is $2,000 in the short-term, but if whales continue with the buying spree, Ethereum might liftoff to higher price levels. Meanwhile, support above $1,500 is needed to sustain the uptrend.
ETH/USD 4-hour chart
The TD Sequential Indicator has flashed a sell signal on the 4-hour chart, which could invalidate the immediate upsurge towards $2,000. The call to sell takes the form of a green nine candlestick. If validated, Ethereum price may drop in one to four 4-hour candlesticks. Apart from $1,500, other potential anchors are the 50 SMA, 100 SMA and 200 SMA.
Ripple slides back into consolidation
Ripple is trading between $0.35 and $0.4 after the pump-and-dump dust settled. Recovery is, however, an uphill battle with the seller congestion at $0.4 unshaken. On the downside, support seems to have been stressed by the 50 SMA on the 4-hour chart.
The ongoing sideways trading has also be validated by the Relative Strength Index, as it levels at the midline. Trading beyond $0.4 will revive the uptrend, with the focus shifting to $0.5.
XRP/USD 4-hour chart
On the flip side, XRP is not out of the woods yet and may tumble further, mostly if the buyer congestion at the 50 SMA ($0.3) is disrupted. In our earlier analysis, XRP’s downtrend eyed $0.28. It is worth mentioning that the 100 SMA and 200 SMA will absorb the selling pressure, thereby preventing a sharp drop.


%20(87)-637479527689484401.png)