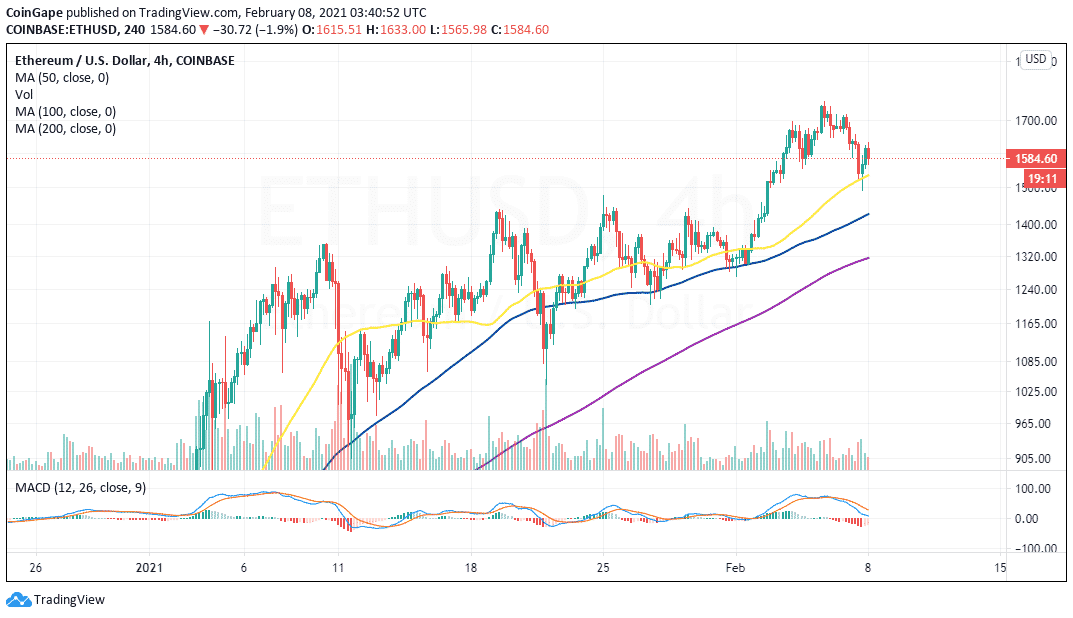
- Ethereum soared to a new all-time high but corrected to retest support at $1,500.
- Higher support, preferably at the 50 SMA on the 4-hour chart will see Ethereum resume the uptrend.
Ethereum recently sliced through a couple of key barriers to trade a new all-time high of $1,765. The largest altcoin has been on this upward trend since the beginning of January. Despite the retreat from the record high, Ethereum seems to be having the potential to overcome the resistance at $1,700 and $1,765 and liftoff to new highs beyond $2,000.
At the time of writing, Ethereum is exchange hands slightly under $1,600. An overhead pressure appears to be intensifying under this level which could see Ethereum tumble to confirm the next crucial anchor at $1,500.
ETH/USD 4-hour chart

The 50 Simple Moving Average came in handy and prevented Ether from dropping further following the retreat from the recent highs. A comprehensive glance at the Moving Average Convergence Divergence (MACD) suggests that the least resistance path is downwards, at least for now.
The MACD line already crossed below the signal line, suggesting that the bears had gained more influence over the price. If the divergence between these two lines continues to widen, Ethereum will likely drop to $1,500 and perhaps retest the 100 SMA support near $1,400 before resuming the uptrend.
On the upside, closing the day above $1,600 would be a massive bullish signal. The price move will call for more buy orders from the investors as bulls increase their positions while anticipating a breakout above $2,000.
Ethereum intraday levels
Spot rate: $1,588
Relative change: -30
Percentage change: -1.85%
Trend: Bearish
Volatility: Expanding
Support one: $1,500
Support two: $1,400
Resistance one: $1,600
Resistance two: 1,765
To keep track of DeFi updates in real time, check out our DeFi news feed Here.


Share on Facebook
Share on Twitter
Share on Linkedin
Share on Telegram