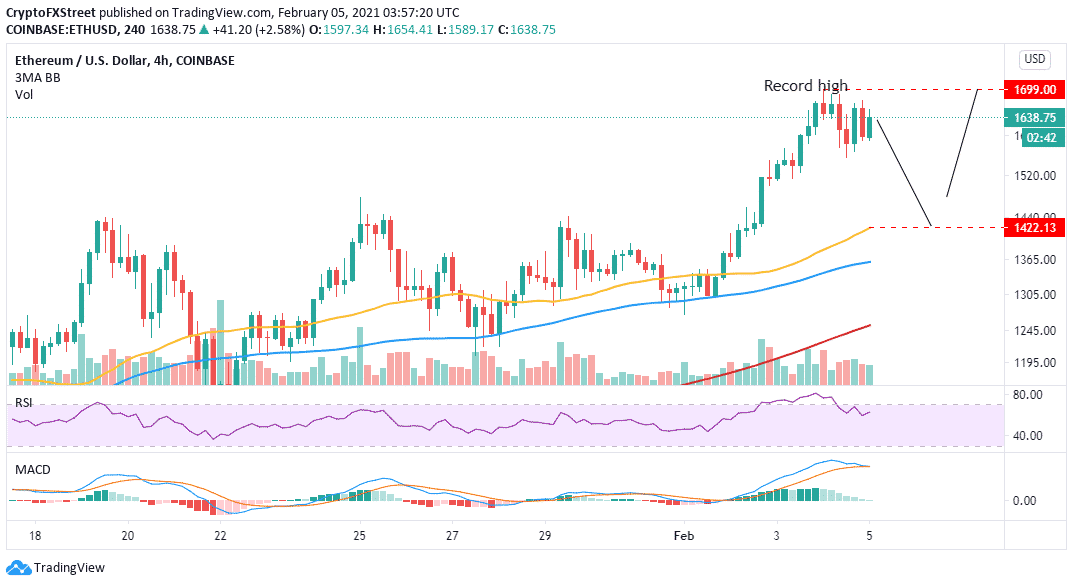
- Ethereum rebounded from the support at $1,550 but ran out of steam to overcome the resistance at $1,700.
- ETH breakdown impends ahead of another upswing to a new all-time high.
Ethereum struggles with sustaining the uptrend after hitting a barrier at its recently achieved record high ($1,700). Support at $1,550 cam came in handy following the rejection. Thus a recovery ensued above $1,600.
In the meantime, Ether is teetering at $1,545 amid the fight to close in on the new all-time high. However, it is doubtful that Ethereum will hit new highs before it retreats to allow more buyers to come in while others increase their positions.
The Moving Average Convergence Divergence (MACD) support this short-term narrative after slowing down on its uptrend. Besides, the MACD line (blue) is most likely to cross below the signal line. This will call out to traders to sell, with some preferring not to increase their exposure.
ETH/USD 4-hour chart

Apart from derailing the uptrend, a breakdown may put a lot of stress on the support at $1,550. The Relative Strength Index has also been purged from the overbought region, hitting that buyers have less influence as the overhead pressure increases.
ETH/USD daily chart

The TD Sequential indicator may present a sell signal on the daily chart, adding credibility to the bearish outlook. The call to sell will manifest in the form of a green nine candlestick. If validated, Ethereum could drop in one to four daily candlesticks. The most probable support is the 50 SMA around $1,440 on the 4-hour chart.
Ethereum intraday levels
Spot rate: $1,635
Relative change: 37
Percentage change: 2.5%
Trend: Undefined
Volatility: Low
To keep track of DeFi updates in real time, check out our DeFi news feed Here.


Share on Facebook
Share on Twitter
Share on Linkedin
Share on Telegram