- Ethereum price remains trading inside a long-term ascending wedge pattern.
- A 12-hour candlestick close above the key resistance trendline would be a clear breakout.
- ETH aims to hit $3,000 in the long-term as it nears $2,000 for now.
Ethereum price is close to $2,000 for the first time ever as Bitcoin price just surpassed $55,000. The digital asset is still underperforming compared to most cryptocurrencies, but there is still hope for the bulls if they can conquer a critical resistance level.
Ethereum price needs a candlestick close above a critical level
On the 12-hour chart, Ethereum has established an ascending wedge pattern and has been rejected from the upper trendline several times in the past two months.
ETH/USD 12-hour chart
A 12-hour candlestick close above this resistance trendline would confirm a breakout that would take Ehereum towards $3,000 after a 45% move calculated using the height of the pattern as a reference.
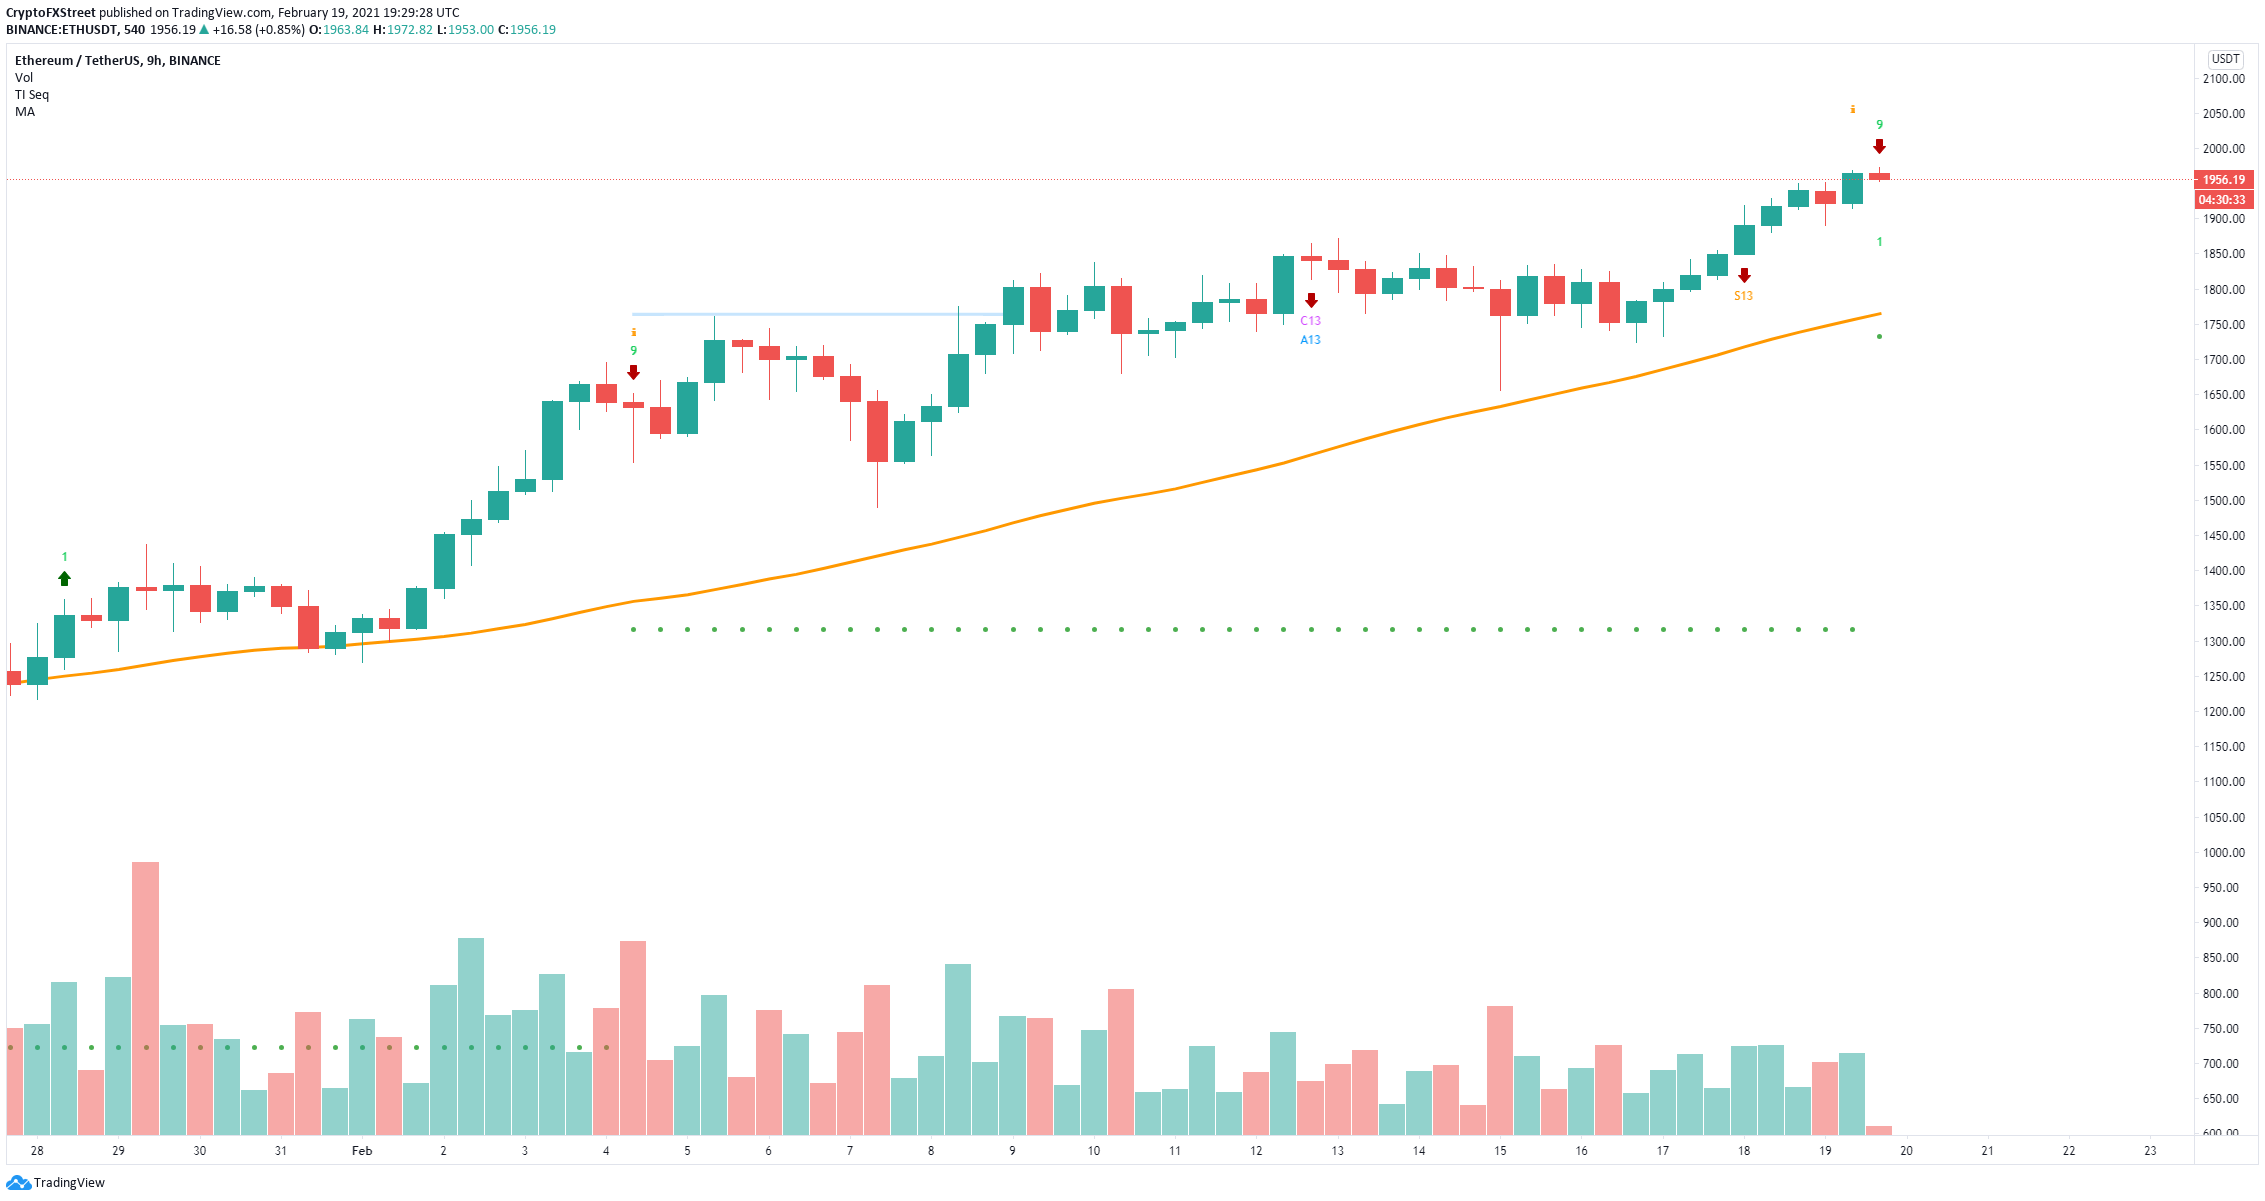
ETH/USD 9-hour chart
However, on the 9-hour chart, the TD Sequential indicator has just presented a sell signal which has been reliable in the past. The next potential support level in case of a sell-off is located at $1,774, which more or less coincides with the lower trendline support of the ascending wedge pattern.

