- Bitcoin sits on the 4-hour SuperTrend, hinting at a possible breakout to $77,000.
- Ethereum rebounds towards $1,800 as bulls look forward to trading around $2,000.
- Ripple found support at $0.5, paving the way for the expected move to $0.75.
Cryptoassets are mostly red following a widespread bearish wave towards the close of the trading session on Sunday. Bitcoin was also caught up in the correction after failing to break the crucial hurdle at $50,000.
However, recoveries have already started across the board, led by the flagship cryptocurrency’s rebound towards $50,000. Ethereum is trading under $1,800 amid the continuous push by buyers for higher highs. Similarly, Ripple suffered significant losses following rejection from $0.65.
Bitcoin is primed for a massive upswing
The pioneer cryptocurrency is resting on top of the SuperTrend indicator. This technical indicator is a trend tracking overlay that resembles a moving average on the chart. It illustrates the prevailing trend direction. The green color shows that the trend has a bullish impulse and could continue to influence Bitcoin price in the near term.
The last time the SuperTrend indicator flipped bullish, Bitcoin rallied by nearly 140%. A break above $50,000 may significantly extend the bullish leg above this area, targeting an upswing to $77,000. For now, the least resistance path is upward, especially with the Relative Strength Index (RSI) bouncing off the midline.
BTC/USD 4-hour chart
Bitcoin’s expected rally above $50,000 may fail to materialize immediately, favouring a consolidation period. Support at $46,000 remains vital, but if selling orders surge, BTC will seek refuge at $44,000.
Ethereum resumes uptrend eyeing $2,000
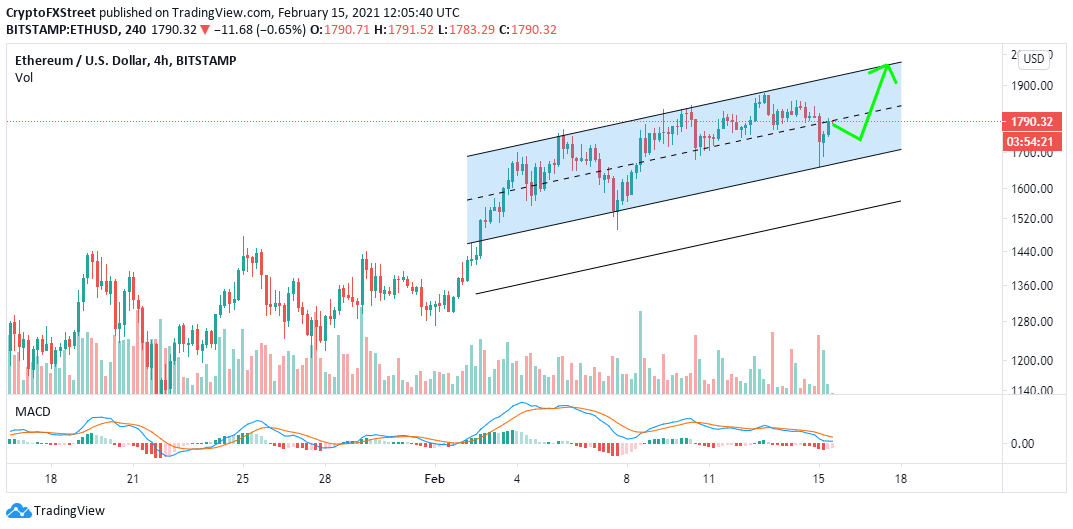
Ethereum has just broken above an ascending channel middle resistance. The uptrend comes after the bearish leg stretched from the recent all-time highs at $1,875 to support around $1,660. Moreover, the channel’s lower edge contributed to strengthening this support, giving credence to the ongoing recovery.
Ether is exchanging hands at $1,790 as bulls push for higher price levels. Closing the day above the channel’s middle boundary or $1,800 will be a major bullish signal. The remaining journey to $2,000 will carry on as the fear of missing out (FOMO) grips retail investors.
A bullish signal will be presented if the Moving Average Convergence Divergence (MACD) holds above the midline. A call to buy is likely to come to the picture if the MACD line (blue) crosses above the signal line.
ETH/USD 4-hour chart
If the smart-contract token makes a daily close under the middle boundary of the channel, the expected upswing to new record highs will be invalidated. On the other hand, correcting below the ascending parallel channel may result in a massive breakdown to support around $1,600.
Ripple bulls relentlessly fight for gains toward $0.75
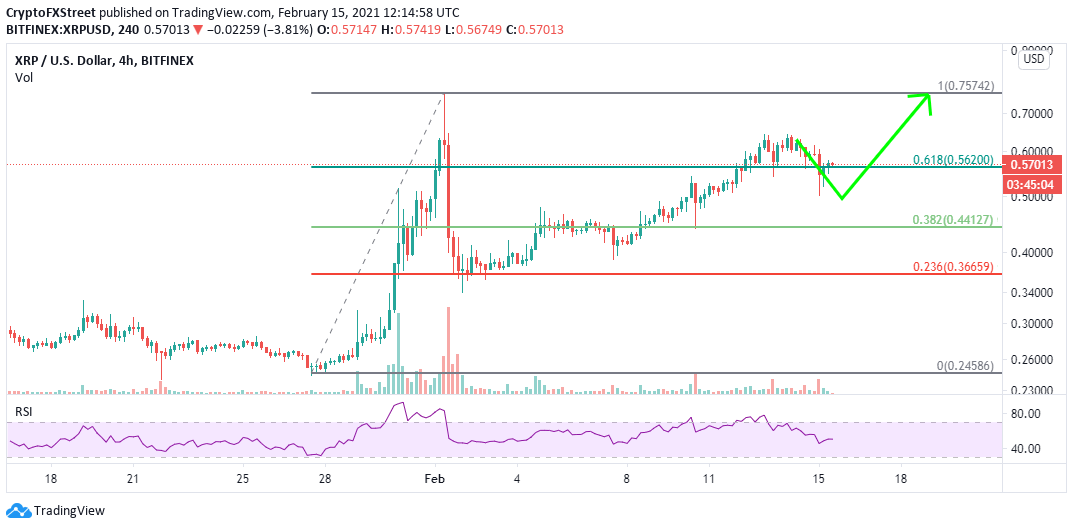
Ripple suffered rejection on approaching $0.65, which put a temporary halt on the uptrend eyeing new yearly highs above $0.75. The retracement overshot the critical 61.8% Fibonacci level, allowing losses to test support at $0.5.
A recovery has ensued, with Ripple gaining the ground above the 61.8% Fibo. The cross-border token is trading at $0.56 at the time of writing, as bulls focus on launching for $0.75. XRP must close the day above the Fibonacci support level to add credence to the bullish outlook. However, a step past $0.6 would call out to more buyers as the uptrend strengthens.
XRP/USD 4-hour chart
The RSI shows that recovery may not come easy and it might be a safe bet to expect a period of consolidation. Simultaneously, if Ripple fails to hold above the 61.8% Fibo, a bearish outlook will emerge, risking losses back to $0.5.


