
XRP/USD – XRP Drops From 200-Days EMA
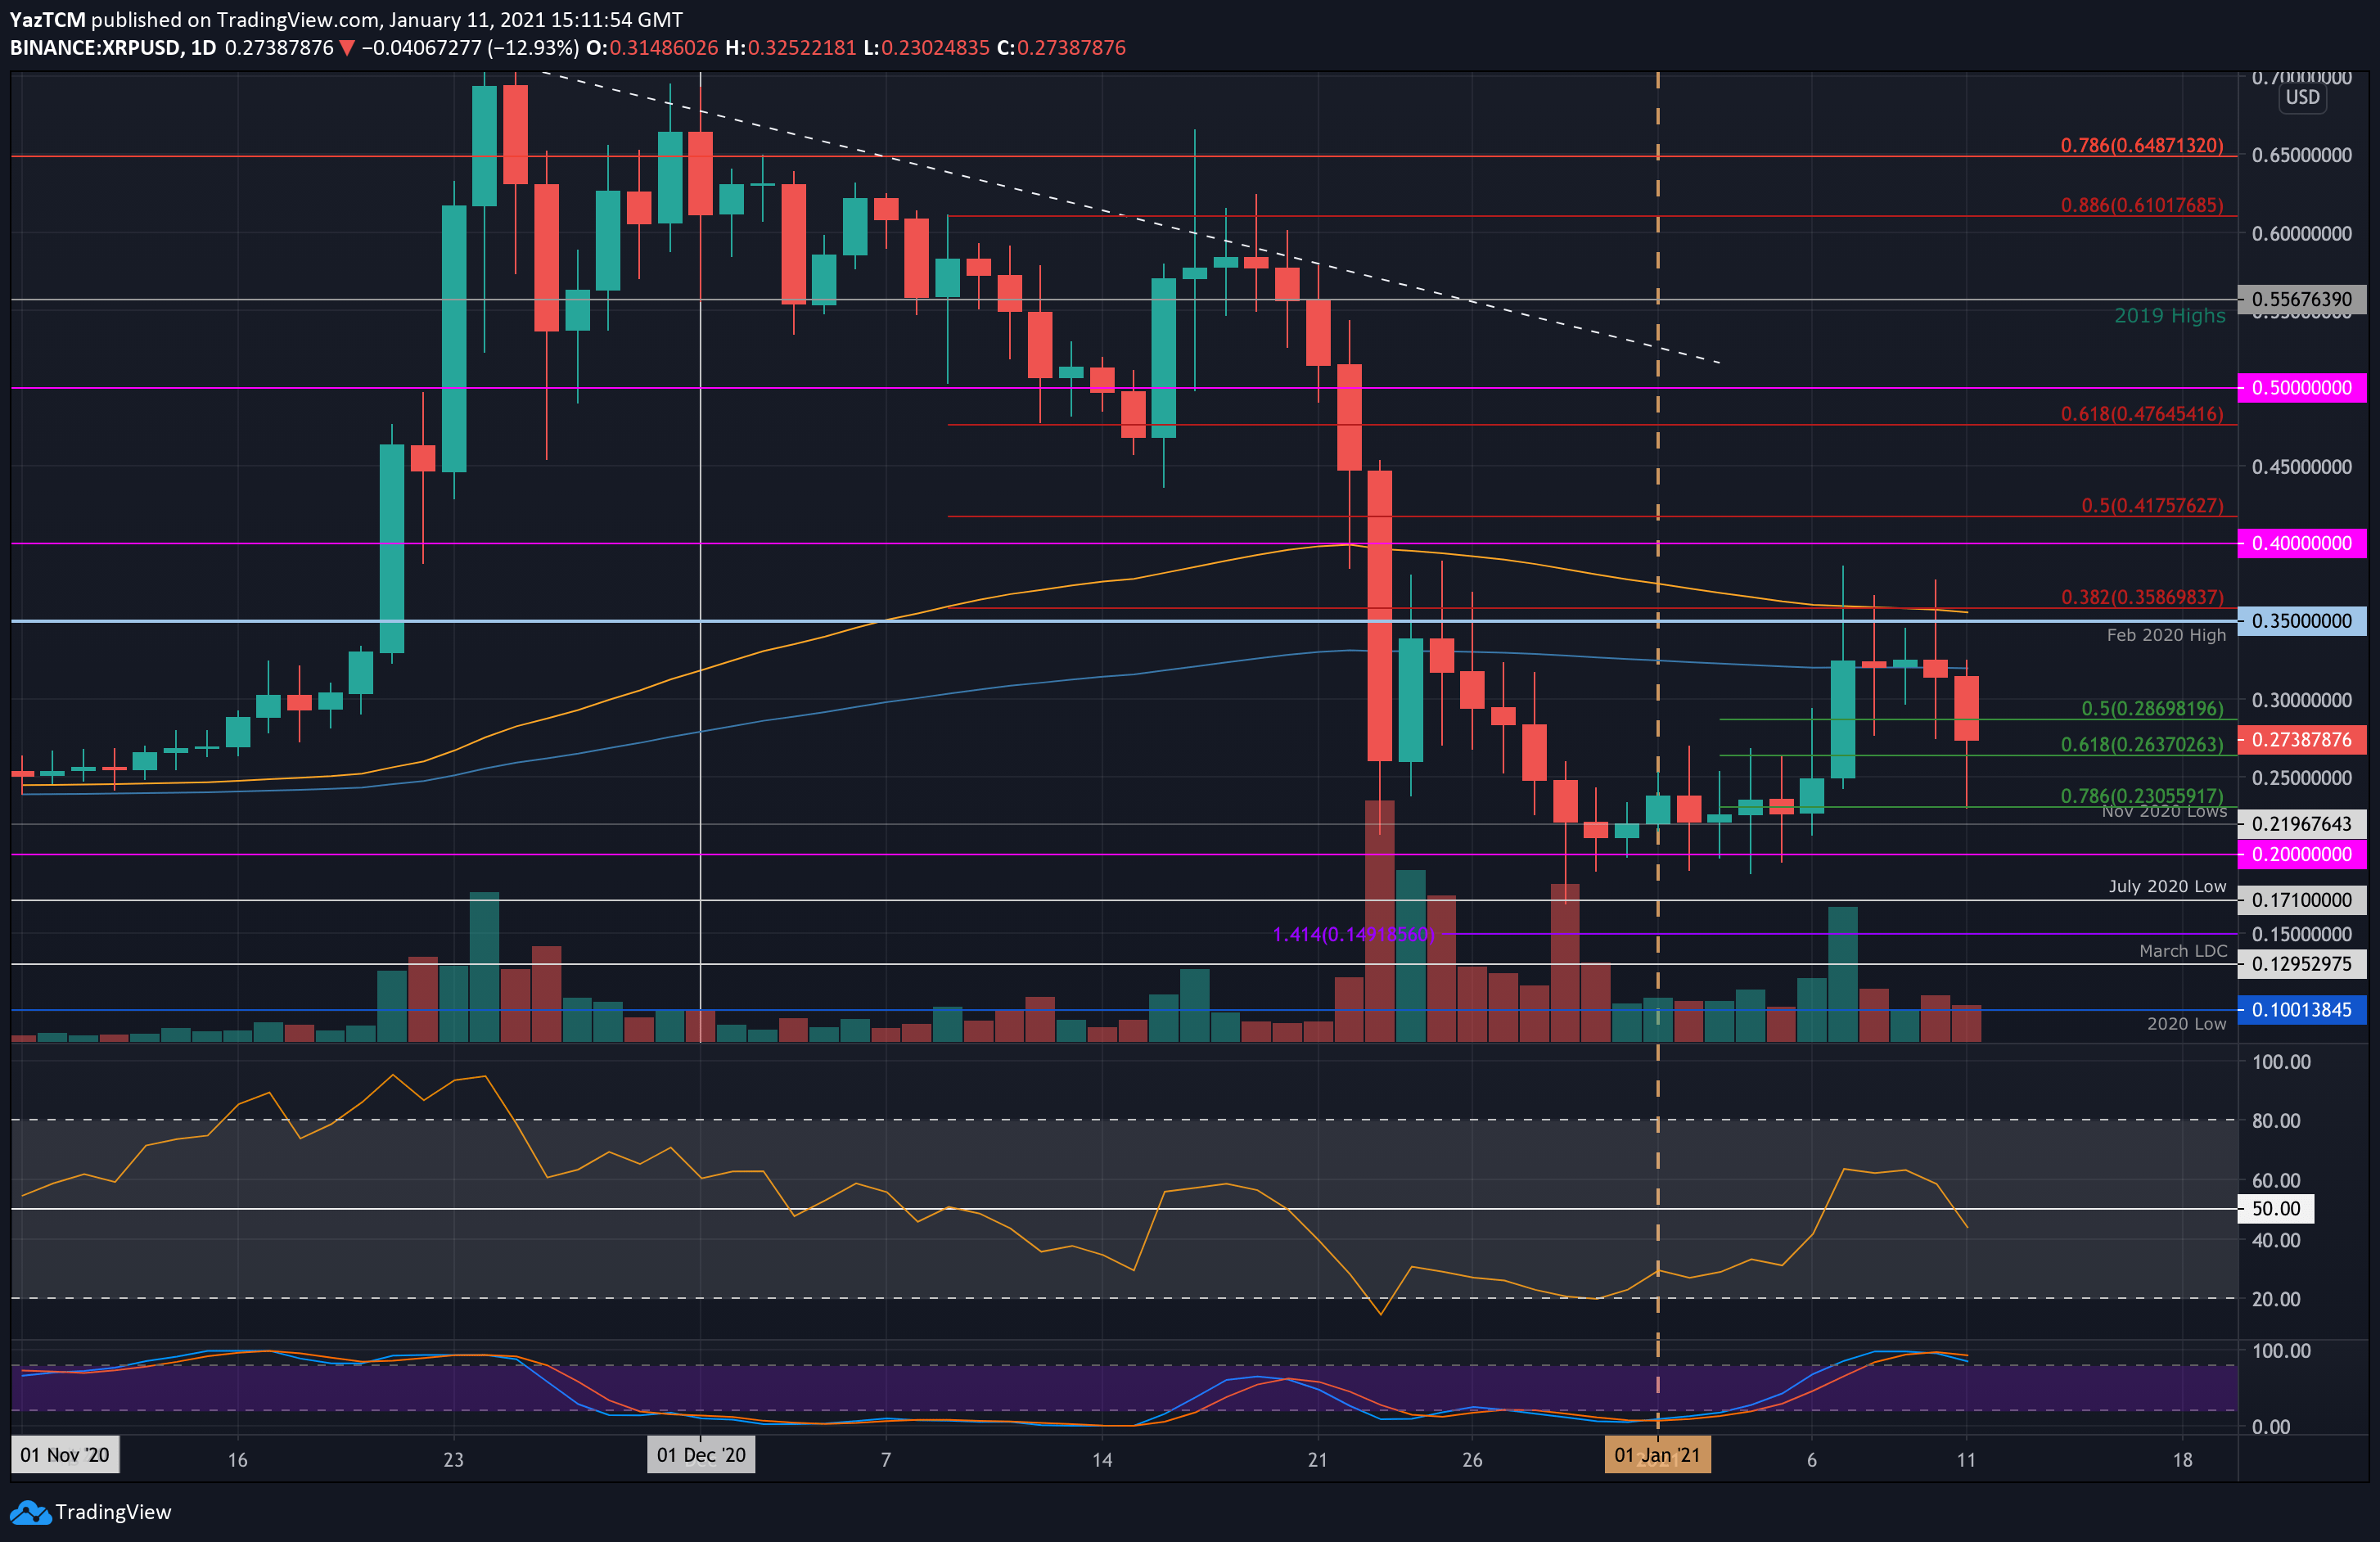
Key Support Levels: $0.263, $0.25, $0.23.
Key Resistance Levels: $0.3, $0.32, $0.35.
Last week, XRP bounced higher from $0.25 to reach the resistance at the 200-days EMA. It traded sideways along with the 200-days EMA for the past five days but the 15% price drop in Bitcoin today caused XRP to drop by 18% as it slides from the 200-days EMA at $0.32 to reach the current $0.273 level.
XRP had spiked further lower earlier in the day but managed to find support at $0.23, provided by the .786 Fib Retracement.
XRP-USD Short Term Price Prediction
Looking ahead, if the bears push lower, the first level of support lies at $0.263 (.618 Fib). This is followed by $0.25, $0.23 (.786 Fib), and $0.22 (Nov 2020 lows). Added support is found at $0.2.
On the other side, the first level of resistance lies at $0.3. This is followed by $0.32 (200-days EMA), $0.35 (Feb 2020 Highs), and $0.358 (bearish .382 Fib Retracement & 100-days EMA).
The daily RSI recently slipped back beneath the midline, suggesting the bears might be about to take control of the market momentum and push XRP lower. If it continues beneath 50, XRP can be expected to head back beneath $0.25.
XRP/BTC – Sideways Range-Bound Action Continues
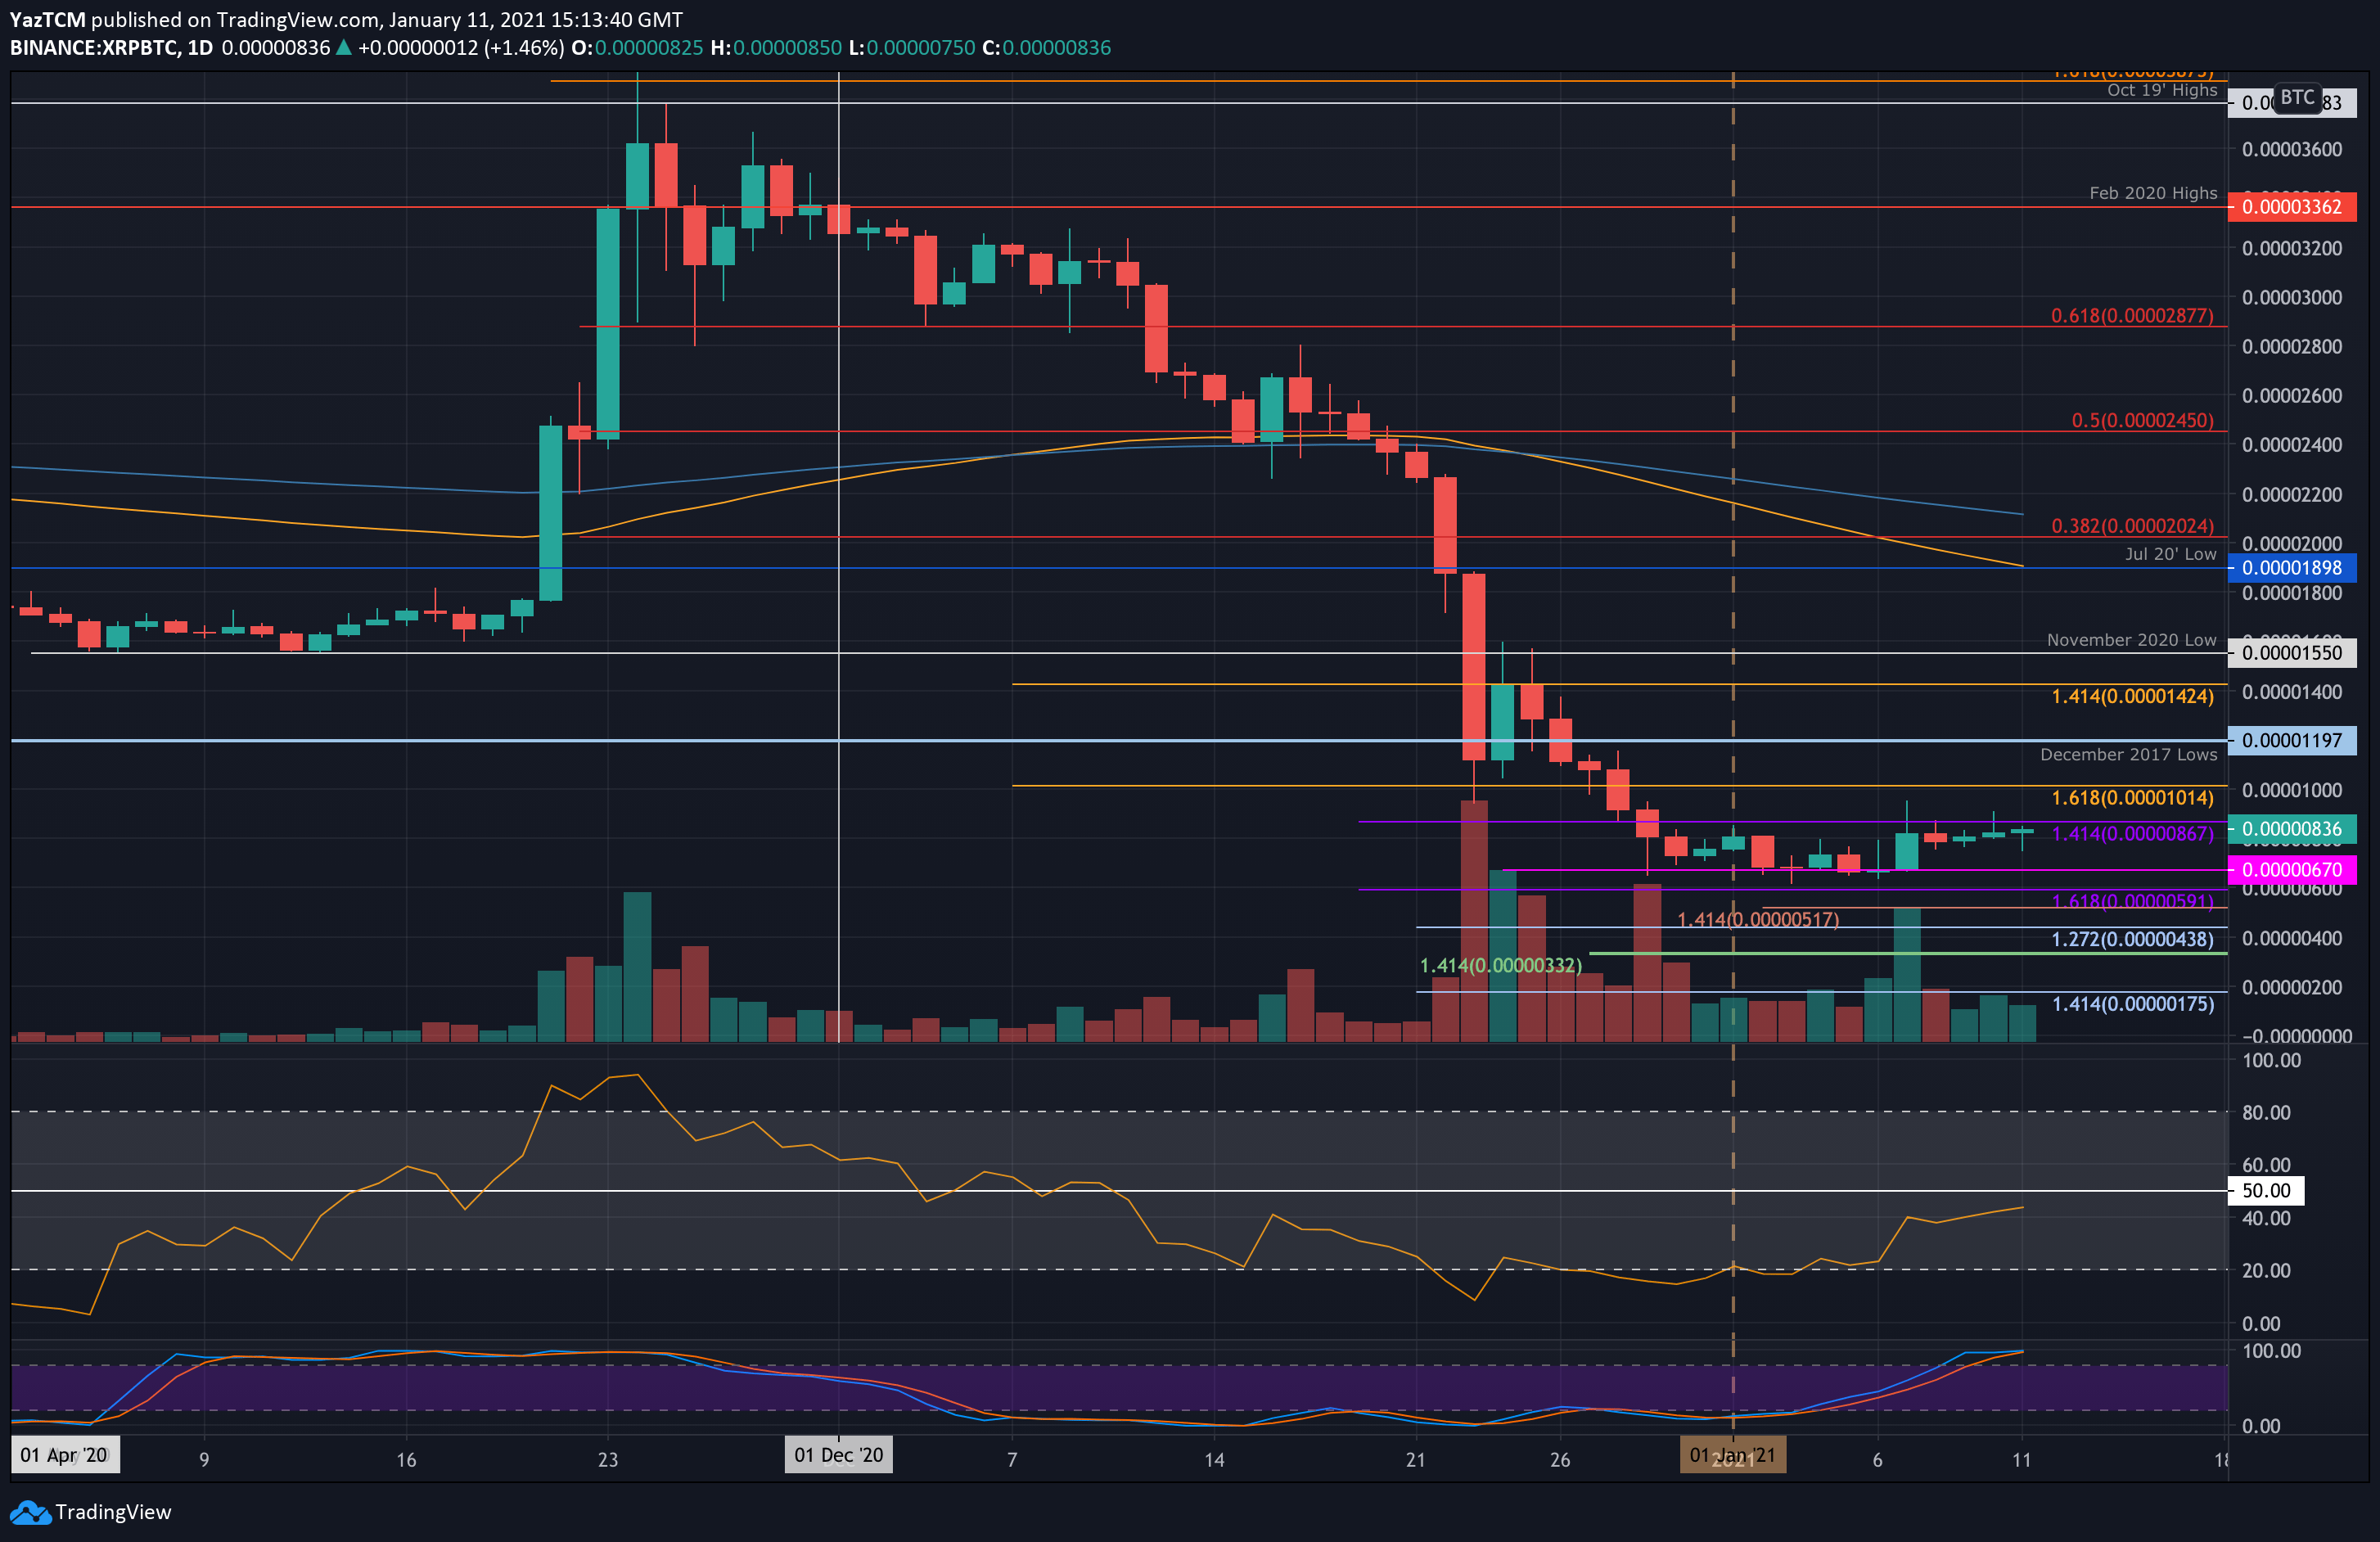
Key Support Levels: 670 SAT SAT, 590 SAT, 500 SAT.
Key Resistance Levels: 900 SAT, 1015 SAT, 1200 SAT.
Against Bitcoin, XRP had dropped over 70% in December as it slipped from 3300 SAT to reach as low as 670 SAT in January 2021.
From there, XRP started trading sideways between this support and resistance at 900 SAT. It must break either of these boundaries to dictate the next direction for the market.
XRP-BTC Short Term Price Prediction
Moving forward, the first level of resistance lies at 900 SAT. This is followed by 1015 SAT, 1200 SAT (December 2017 lows), and 1500 SAT (November 2020 lows).
On the other side, the first level of support lies at 670 SAT. This is followed by 590 SAT, 520 SAT, 500 SAT, and 440 SAT.
The RSI is climbing, indicating the previous bearish momentum is dissipating within the market. It would still need to break the mid-line to show bullish momentum within the market.
PrimeXBT Special Offer: Use this link to register & enter CRYPTOPOTATO35 code to get 35% free bonus on any deposit up to 1 BTC.
Disclaimer: Information found on CryptoPotato is those of writers quoted. It does not represent the opinions of CryptoPotato on whether to buy, sell, or hold any investments. You are advised to conduct your own research before making any investment decisions. Use provided information at your own risk. See Disclaimer for more information.
Cryptocurrency charts by TradingView.