
The Ethereum Classic (ETC) price has been trading inside a range between $3.50 and $9.40 for more than two years.
While an eventual breakout is likely, ETC could drop once more before this occurs.
Trading Range
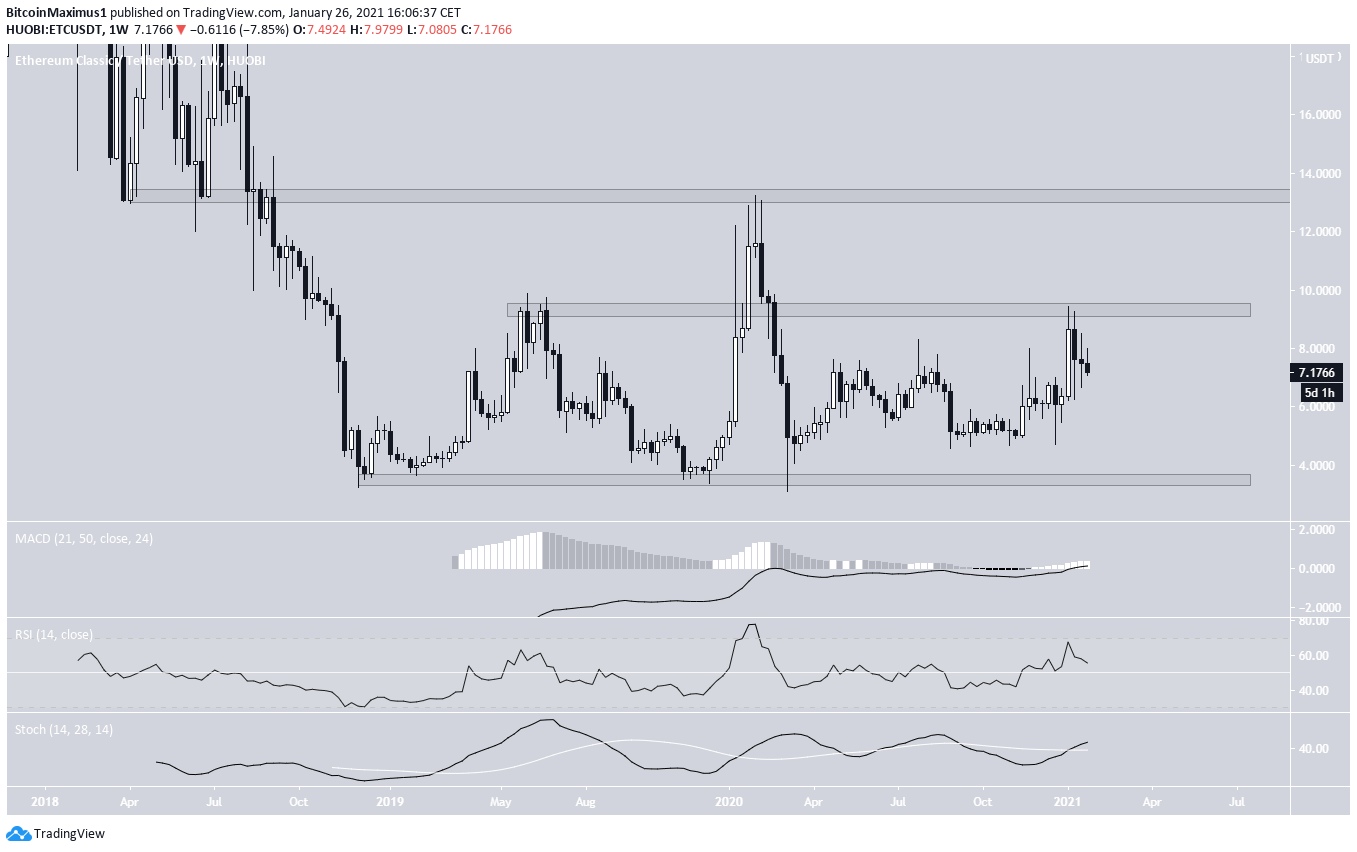
ETC has been trading in a range between $3.50 and $9.40 since December 2018. Most recently, it reached the resistance area on Jan. 10, 2020, but was promptly rejected and has been falling since.
However, technical indicators on the weekly time-frame are bullish, indicating that an eventual breakout is likely. If one occurs, the next closest resistance area would be at $13.20.
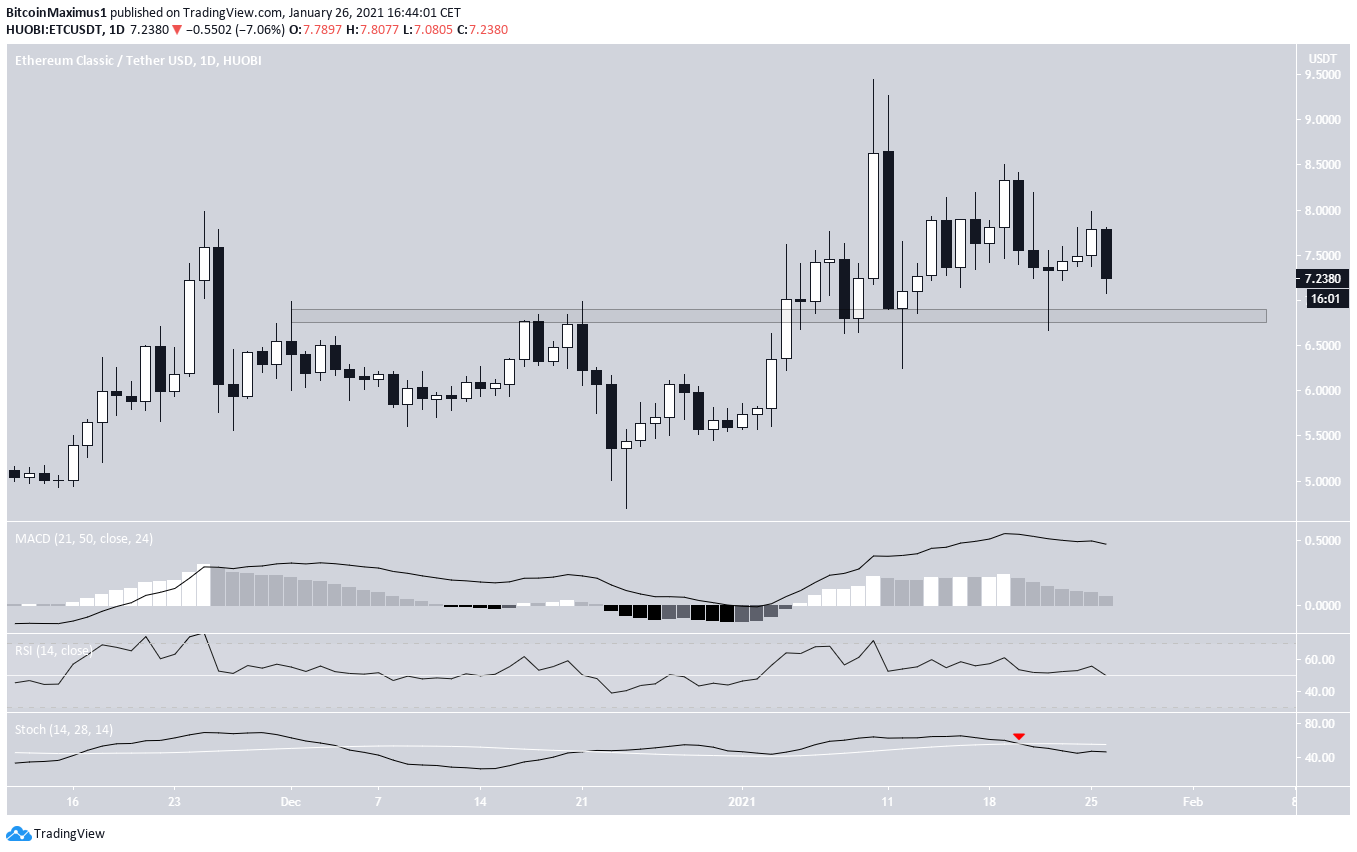
The daily chart shows a minor support level at $6.80, which has been tested numerous times, creating long lower wicks each time.
However, technical indicators are decisively bearish, indicating that another retest and possible breakdown is likely.

Short-Term Movement
Cryptocurrency trading bot @Gainzybot signaled a buying opportunity for ETC when the price was trading around $7.82.

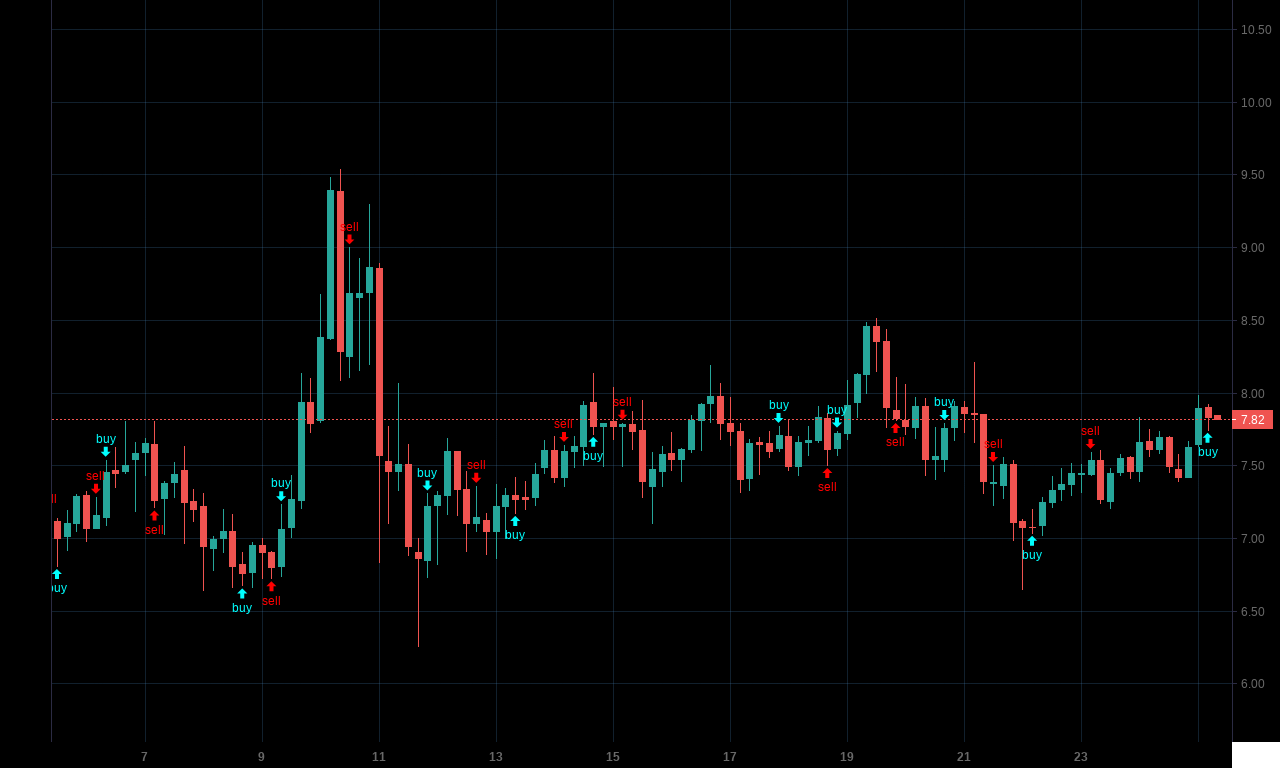
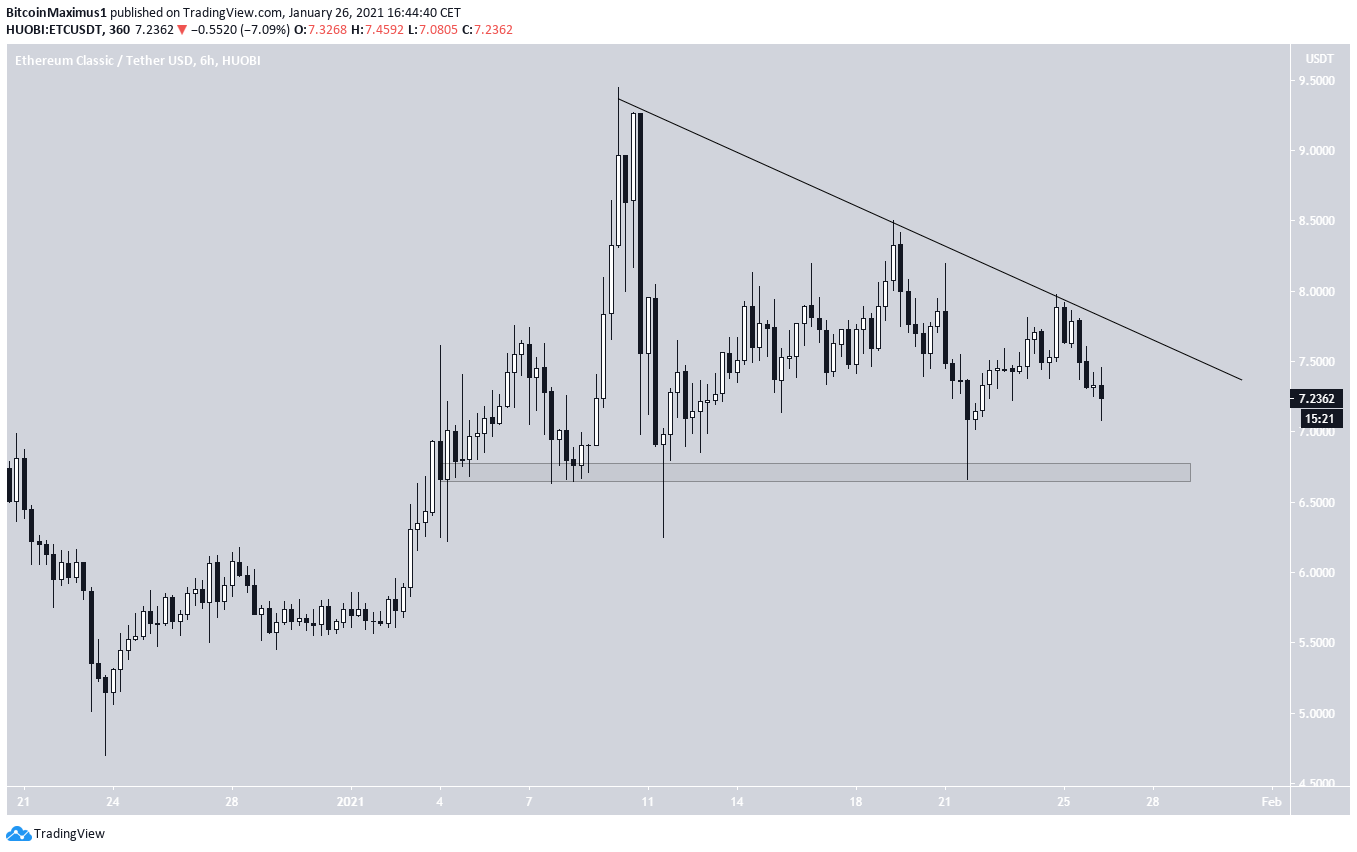
Initially, ETC began an upward move but was rejected shortly afterward. The drop validated the descending resistance line that has been in place since Jan. 10.
Combined with the previous support area, this created a descending triangle, which is a bearish pattern. This fits with the daily time-frame reading, which indicates that a drop is likely.
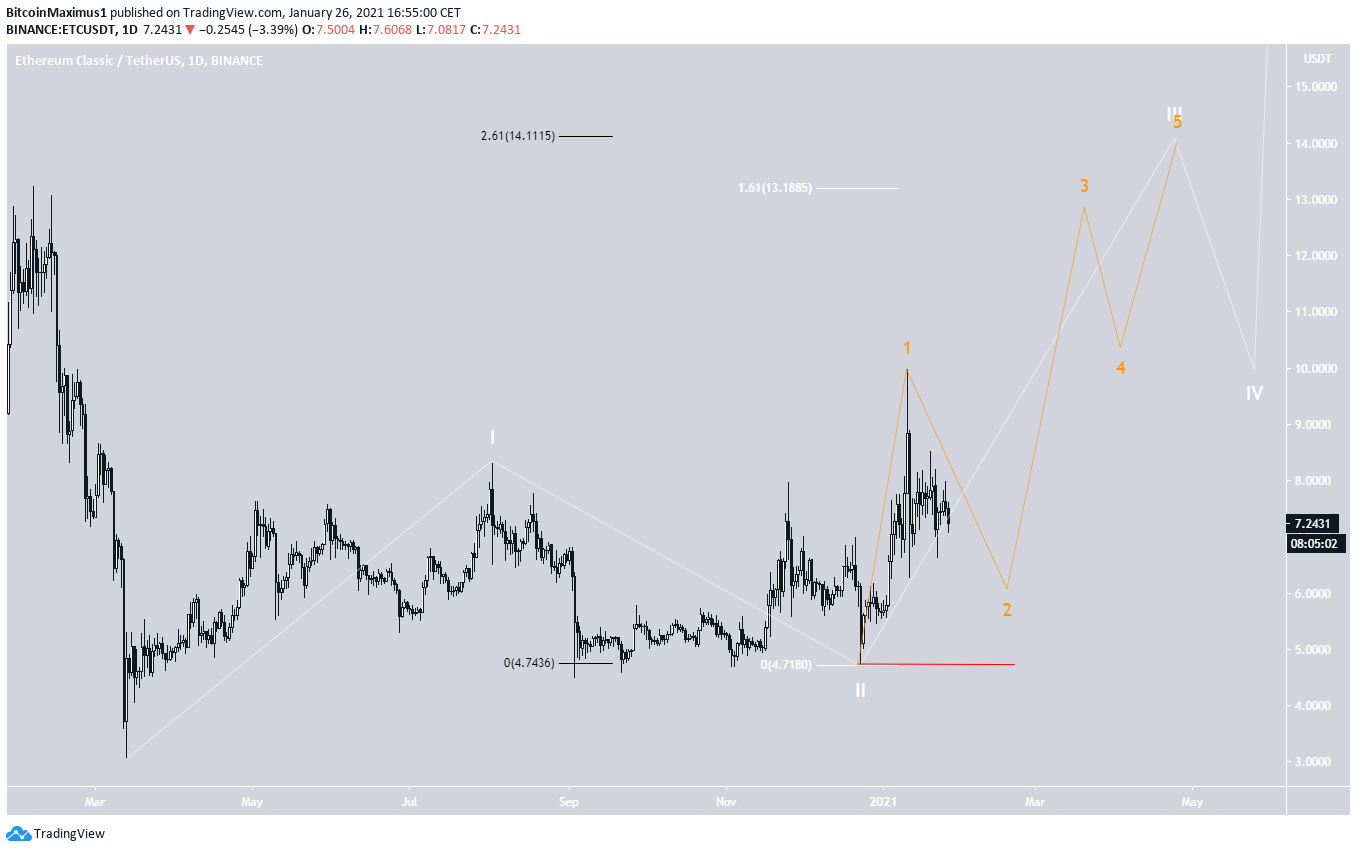
Wave Count
The wave count suggests that ETC is in wave three of a long-term bullish impulse that began with the March 2020 lows. A likely target for the top of wave 3 is between $13.18 and $14.11, found using both a Fib projection and external retracement.
In addition, it is a horizontal resistance area. A decline below the wave two low at $4.71 (red line) would invalidate this particular wave count. The sub-wave count is given in orange.
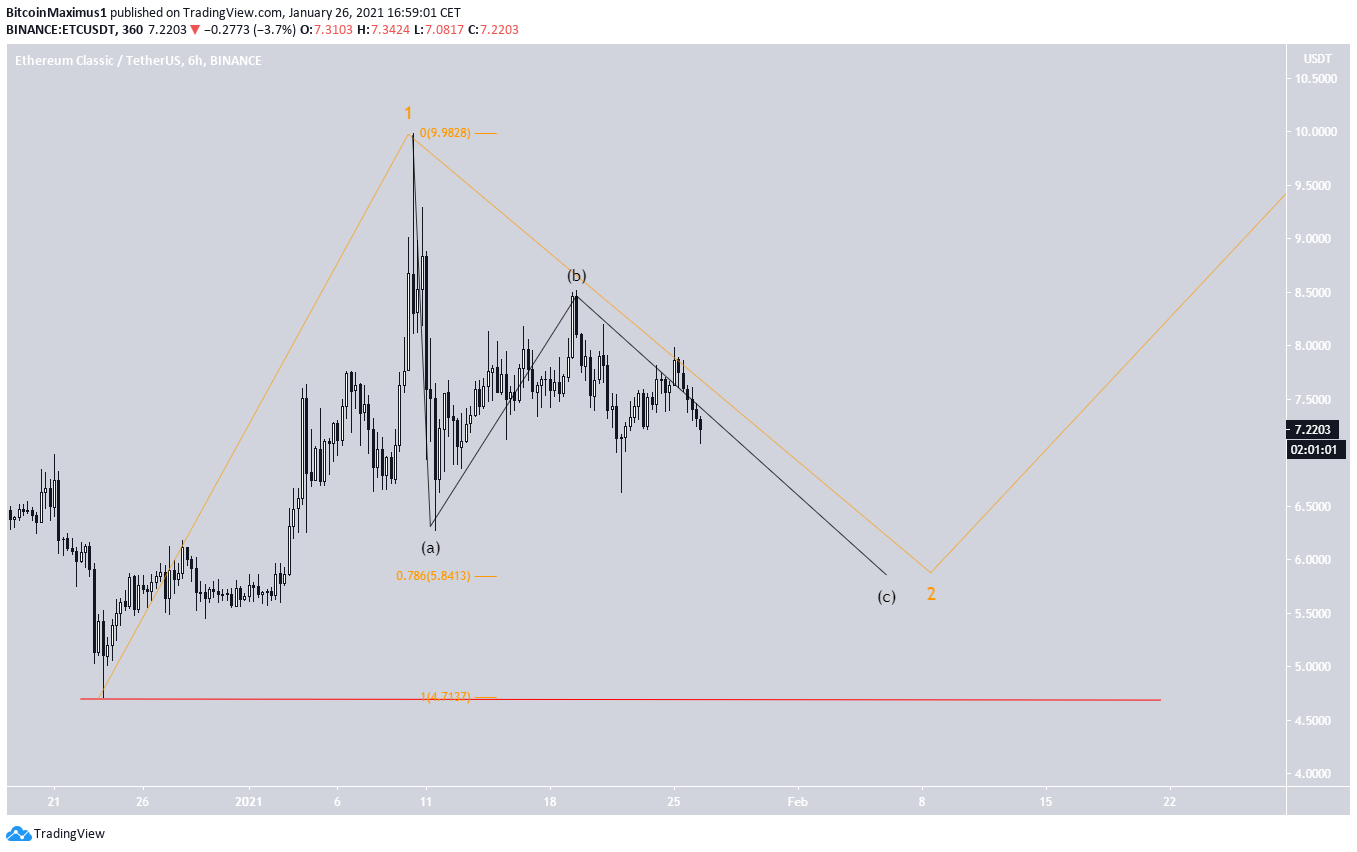
A closer look reveals that ETC is likely in the minor sub-wave C (black) of sub-wave 2 (orange).
A breakdown from the triangle should complete this sub-wave, taking ETC down to $5.80, the 0.786 Fib retracement level of the current upward move.
Afterward, ETC should break out from its long-term range.
Conclusion
To conclude, despite the long-term bullish trend, ETC is likely to drop in the short-term and continue consolidating in its range before an eventual breakout.
For BeInCrypto’s latest Bitcoin (BTC) analysis, click here!
Disclaimer
All the information contained on our website is published in good faith and for general information purposes only. Any action the reader takes upon the information found on our website is strictly at their own risk.