Bitcoin, Ethereum, Cryptocurrencies, BTC/ETH Ratio, Technical Analysis – Talking Points:
- Ratio analysis suggests that Ethereum will continue to outperform Bitcoin in the near term.
- Ethereum poised to continue pushing to fresh all-time highs as price remains constructively poised above key support.
- Bitcoin prices are consolidating within a Descending Triangle pattern. Is a topside breakout on the cards?
Bitcoin prices have tumbled in recent weeks, falling as much as 31% from the record high set on January 8 (41969). Meanwhile, Ethereum has continued to aim higher, with second-most popular cryptocurrency gearing up to exceed its respective all-time high set.
BTC/ETH Ratio Daily Chart
BTC/ETH ratio daily chart created using Tradingview
Indeed, Ethereum’s outperformance looks set to endure in the near term, as the BTC/ETH ratio breaks to its lowest levels since August of 2018. That being said, both cryptocurrencies seem poised to move higher in the coming weeks, as bullish technical setups take shape on multiple timeframes. Here are the key technical levels to watch for BTC and ETH.
Bitcoin (BTC) Weekly Chart – Consolidating above 28,000
BTC weekly chart created using Tradingview
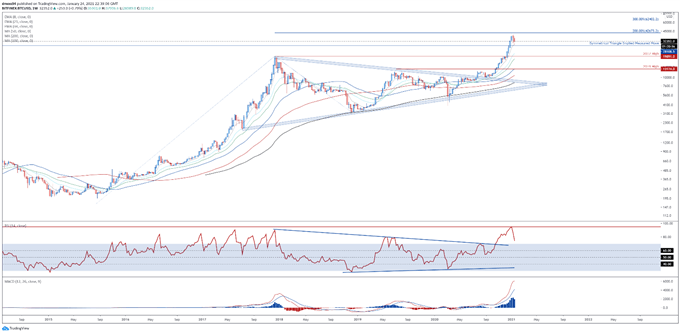
The longer-term outlook for Bitcoin remains skewed to the upside, as price holds constructively above the Symmetrical Triangle pattern’s implied measured move (28108) and the 8-week exponential moving average (29309).
Although the RSI has aggressively turned lower, prices have yet to erase the gains seen in the week ending January 4, which suggests that the path of least resistance is skewed to the topside.
Ultimately, a convincing push above the 200% Fibonacci (42673) is needed to signal the resumption of the primary uptrend and clear a path for prices to challenge the psychologically imposing 60,000 mark.
Alternatively, sliding back below 28,000 could intensify selling pressure and drive prices back towards former resistance-turned-support at the 2017 high. Clearing that likely brings the 2019 high (13174) into focus.
Bitcoin (BTC) Daily Chart – Descending Triangle in Play
BTC daily chart created using Tradingview
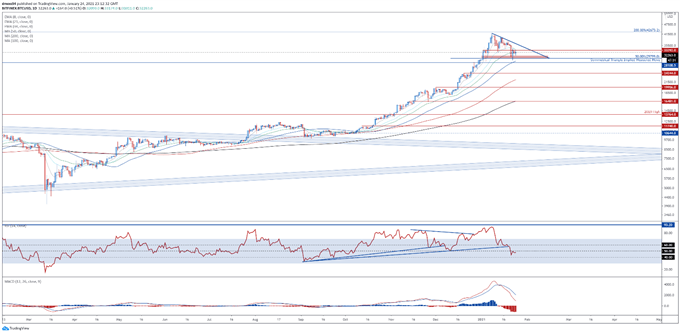
Zooming into the daily chart reinforces the relatively bullish outlook depicted on the weekly timeframe, as prices consolidate within a Descending Triangle above the 50% Fibonacci (29799).
Breaching triangle resistance and the 35,000 mark would likely ignite an impulsive topside move to challenge the yearly high (41969). The Descending Triangle’s implied measured move suggesting prices could climb an additional 31% from current levels to probe the 47,000 mark.
Conversely, a daily close below the monthly low (28540) could propel price back towards former resistance-turned-support at the December 20 high (24244). The pattern’s implied measure move suggesting that price could fall as much as 45% from current levels to test the sentiment-defining 200-day moving average (16508).
Ethereum (ETH) Weekly Chart – Double Top or Parabolic Surge?
ETH weekly chart created using Tradingview
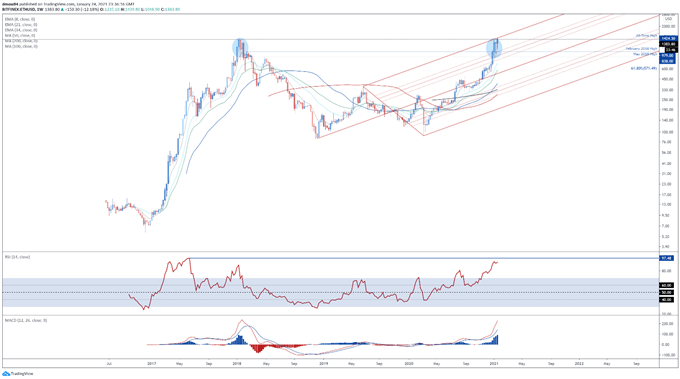
Ethereum, on the other hand, has a rather mixed technical outlook as prices carve out a potential Double Top pattern at Pitchfork parallel resistance and the 1400 mark.
However, this could prove to be the start of a parabolic surge higher, in a similar fashion to that seen in 2017, as a bullish ‘golden cross’ takes place on the 50- and 200-week moving averages.
Ultimately, a weekly close above the 2018 high (1424.3) is required to neutralize near-term selling pressure and carve a path for buyers to probe the 2000 mark.
On the other hand, if the pitchfork parallel remains intact, a short term pullback towards the February 2018 high (979) could be on the cards.
Ethereum (ETH) Daily Chart – Bullish MA Stacking Hints at Further Upside
ETH daily chart created using Tradingview
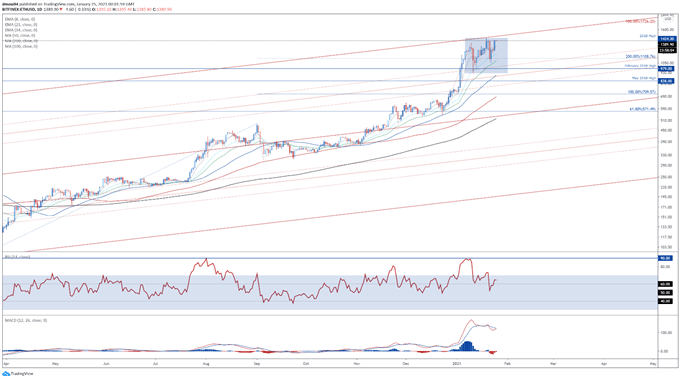
Scrolling into the daily timeframe hints at further upside for Ethereum, as prices continue to track above all six moving averages and psychological support at 1300.
Bullish moving average stacking, in tandem with the RSI continuing to track above 60 and the MACD indicator gearing up to cross above its ‘slower’ signal line counterpart, the path of least resistance seems higher.
A daily close above the Pitchfork parallel and January high (1439.8) would probably propel price towards the 1500 mark, with a convincing break above bringing the 100% Fibonacci expansion (1726) into focus.
On the contrary, failing to hurdle 1425 could trigger a pullback to the 21-day EMA (1188). Clearing that probably opens the door for sellers to challenge psychological support at 1000.
— Written by Daniel Moss, Analyst for DailyFX
Follow me on Twitter @DanielGMoss


Recommended by Daniel Moss
Top Trading Lessons


