- Ethereum continues to follow the ascending trend line on daily chart.
- RSI indicator suggests there is room on the upside before ETH turns overbought.
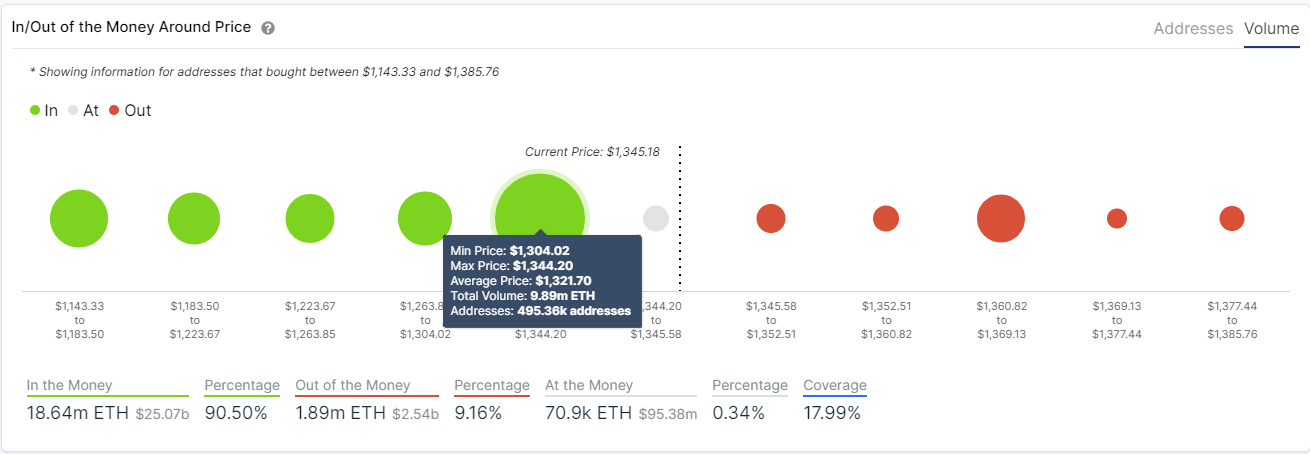
- Strong support seems to have formed around $1,300, according to on-chain metrics.
Ethereum climbed to a fresh record high of $1,477 at the start of the week but struggled to preserve its bullish momentum. After staging a technical correction toward $1,200, however, ETH regained its traction and seems to have gone into a consolidation phase. At the moment, Ethereum is down 2.03% on a daily basis at $1,350.
Key support sits at $1,300
On the daily chart, the ascending trend line coming from late December remains intact and is currently located around $1,300. If ETH manages to hold above that line, it could renew all-time highs and target the next psychological level at $1,500. Moreover, an ascending triangle using the trend line and the static resistance at $1,400 seems to have formed on the same chart, confirming the view that a bullish breakout is likely.
In the meantime, the daily Relative Strength Index (RSI) continues to float around 60, suggesting that ETH has more room on the upside before becoming technically overbought.
ETH/USD one-day chart
Punctuating the significance of $1,300 support, IntoTheBlock’s In/Out of the Money Around Price (IOMAP) chart shows that nearly 10 million ETH had been bought by around 500K addresses at an average price of $1,320.
ETH IOMAP chart
On the other hand, a daily close below $1,300 could attract more sellers and drag ETH toward next static supports at $1,230 and $1,100.

