
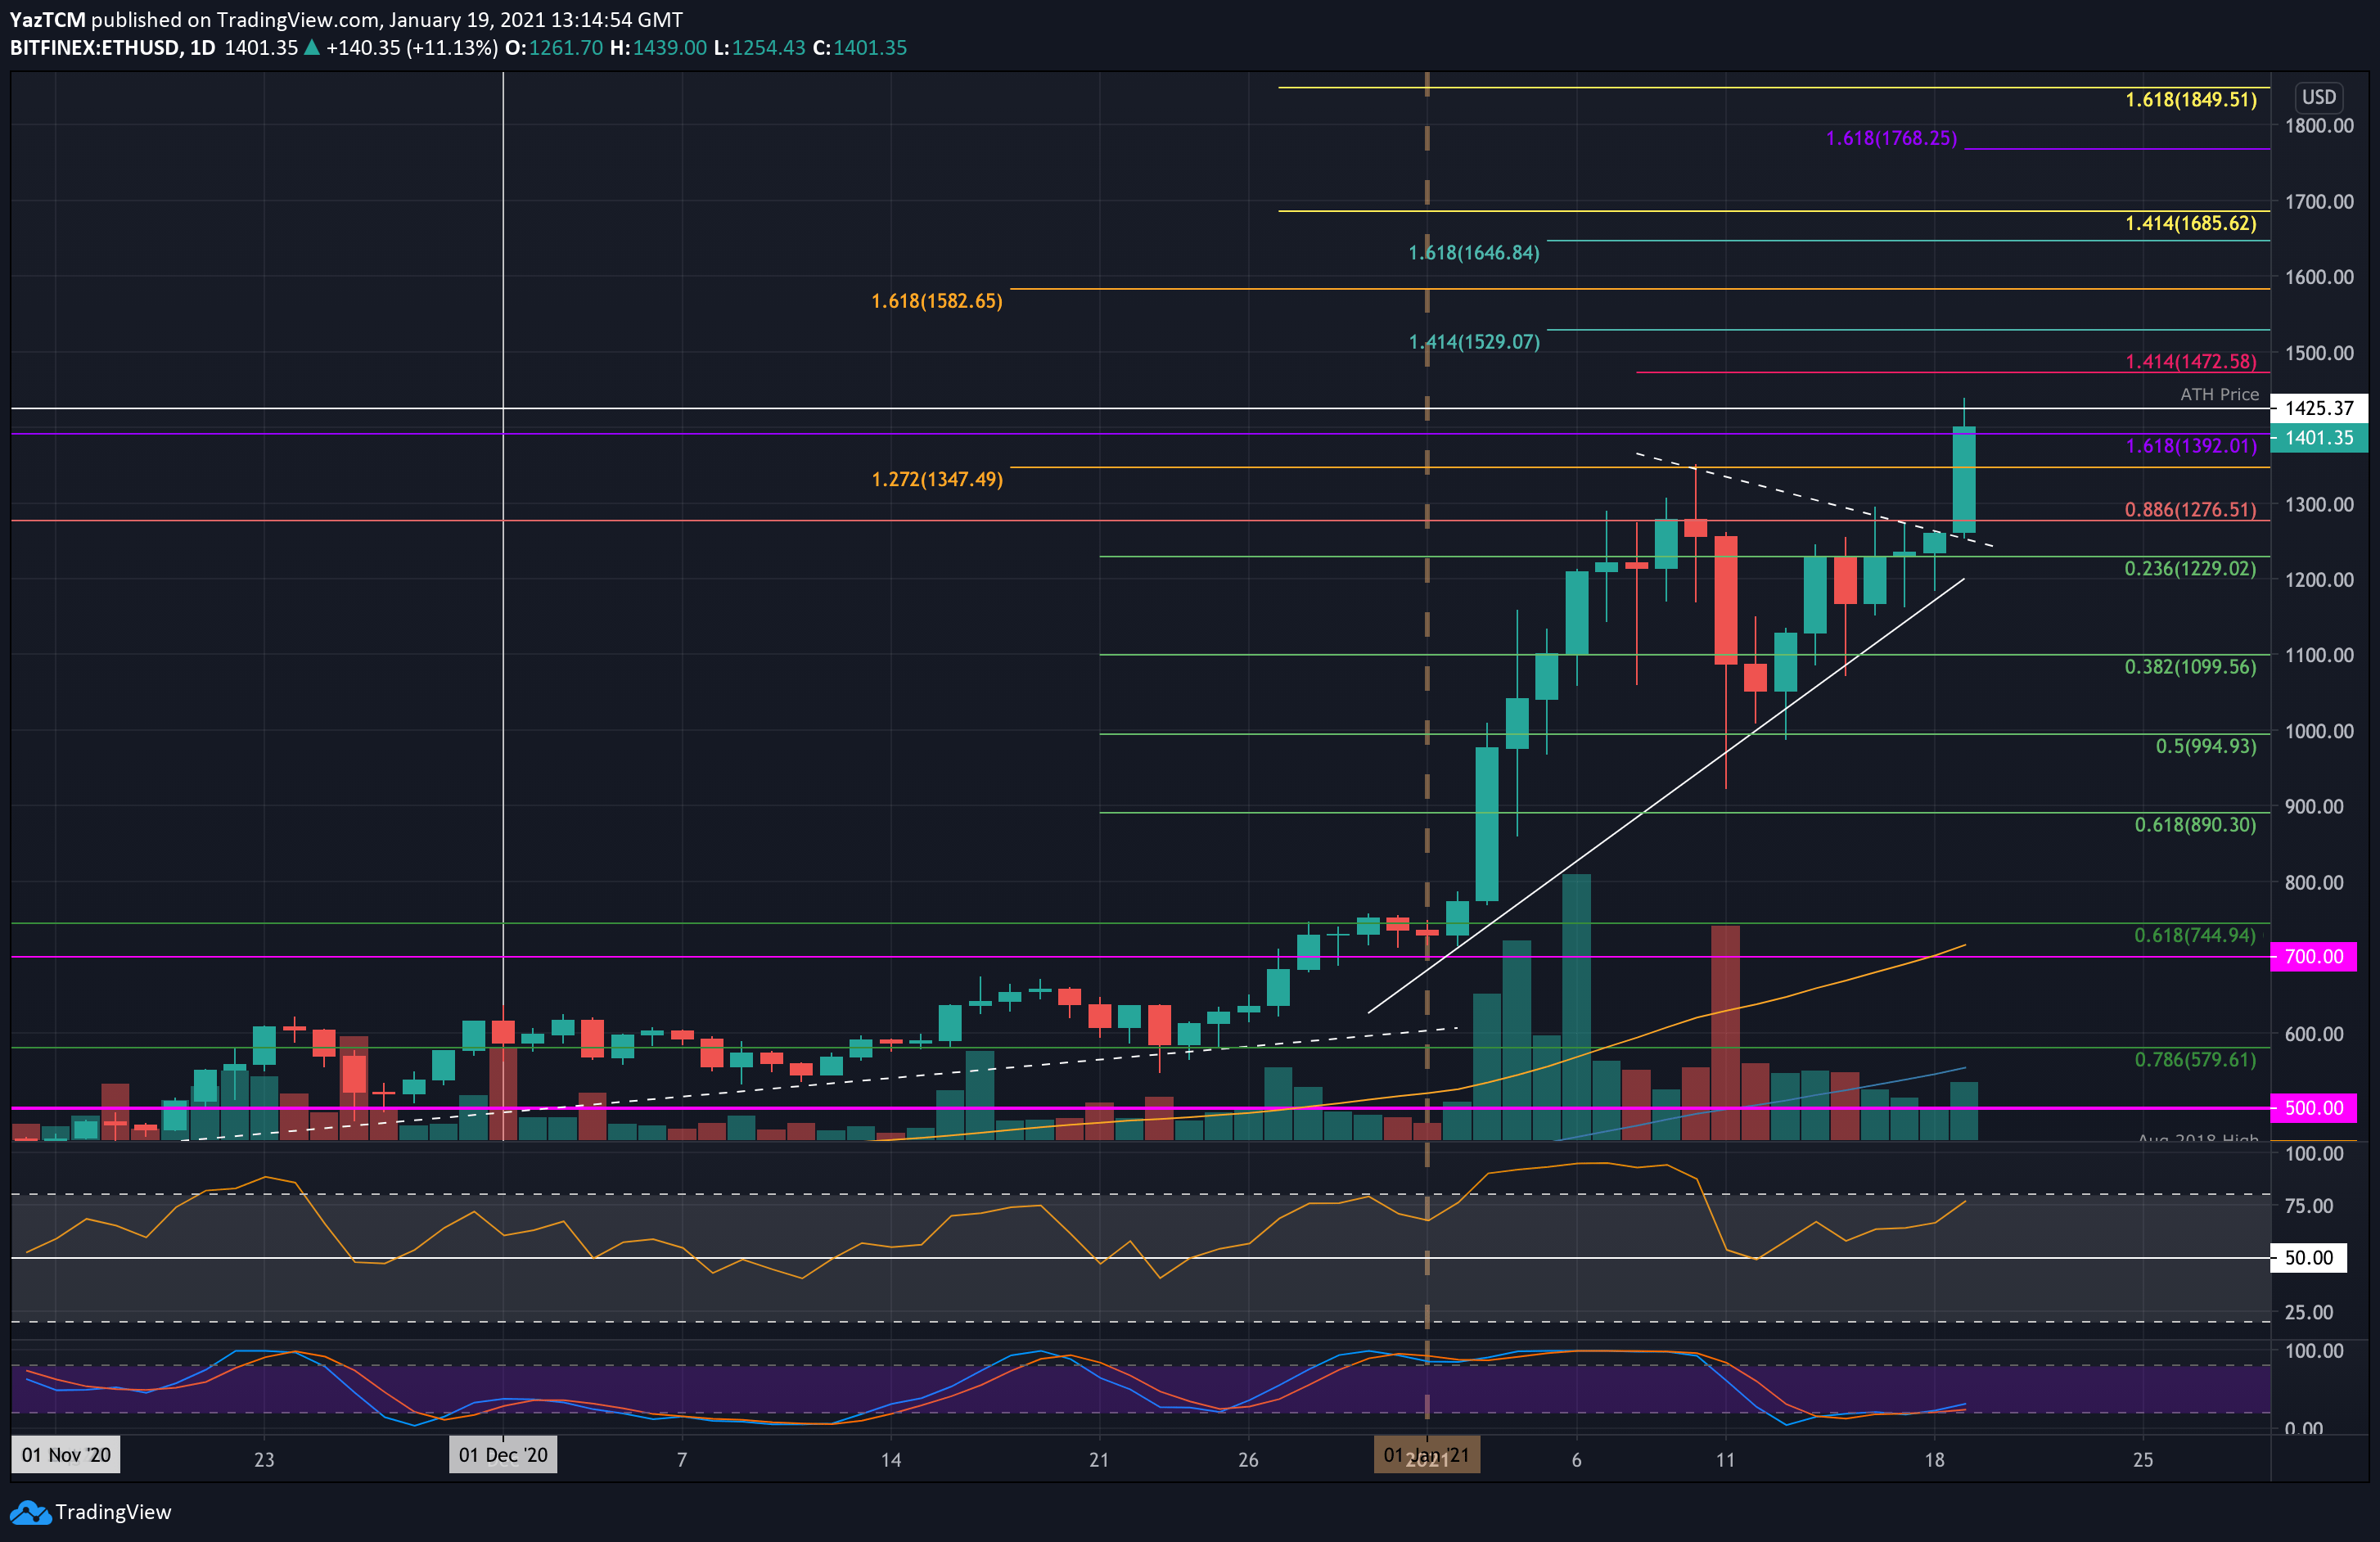
ETH/USD – Bulls Set New ATH Price
Key Support Levels: $1390, $1350, $1275.
Key Resistance Levels: $1473, $1530, $1600.
Ethereum was trading in a short term symmetrical triangle pattern as it struggled to break resistance at $1276 (bearish .886 Fib) over the past four days of trading. This resistance was finally broken with today’s 12% price hike, which saw the cryptocurrency breaking the previous ATH record.
It went on to set a new ATH price at $1439, marginally above the previous one at $1425. With the bullish momentum within the market, we could see higher ATHs over the course of the day. It has since dropped to $1400 at the time of writing.
ETH-USD Short Term Price Prediction
Looking ahead, once the bulls clear the new ATH, the first level of resistance lies at $1473 (short term 1.414 Fib Extension). This is followed by $1530 (1.414 Fib Extension -green), $1600, and $1646 (1.618 Fib Extension – green).
Additional resistance is expected at $1685 (1.414 Fib Extension – yellow), $1700, and $1768.
On the other side, the first level of support lies at $1390. This is followed by $1350, $1275, $1230 (.236 Fib Retracement & rising support line), and $1100 (.382 Fib Retracement).
The RSI is rising and is far from overbought, indicating the market has room to push higher. Additionally, the Stochastic RSI is primed for a bullish crossover signal that should send the market higher.
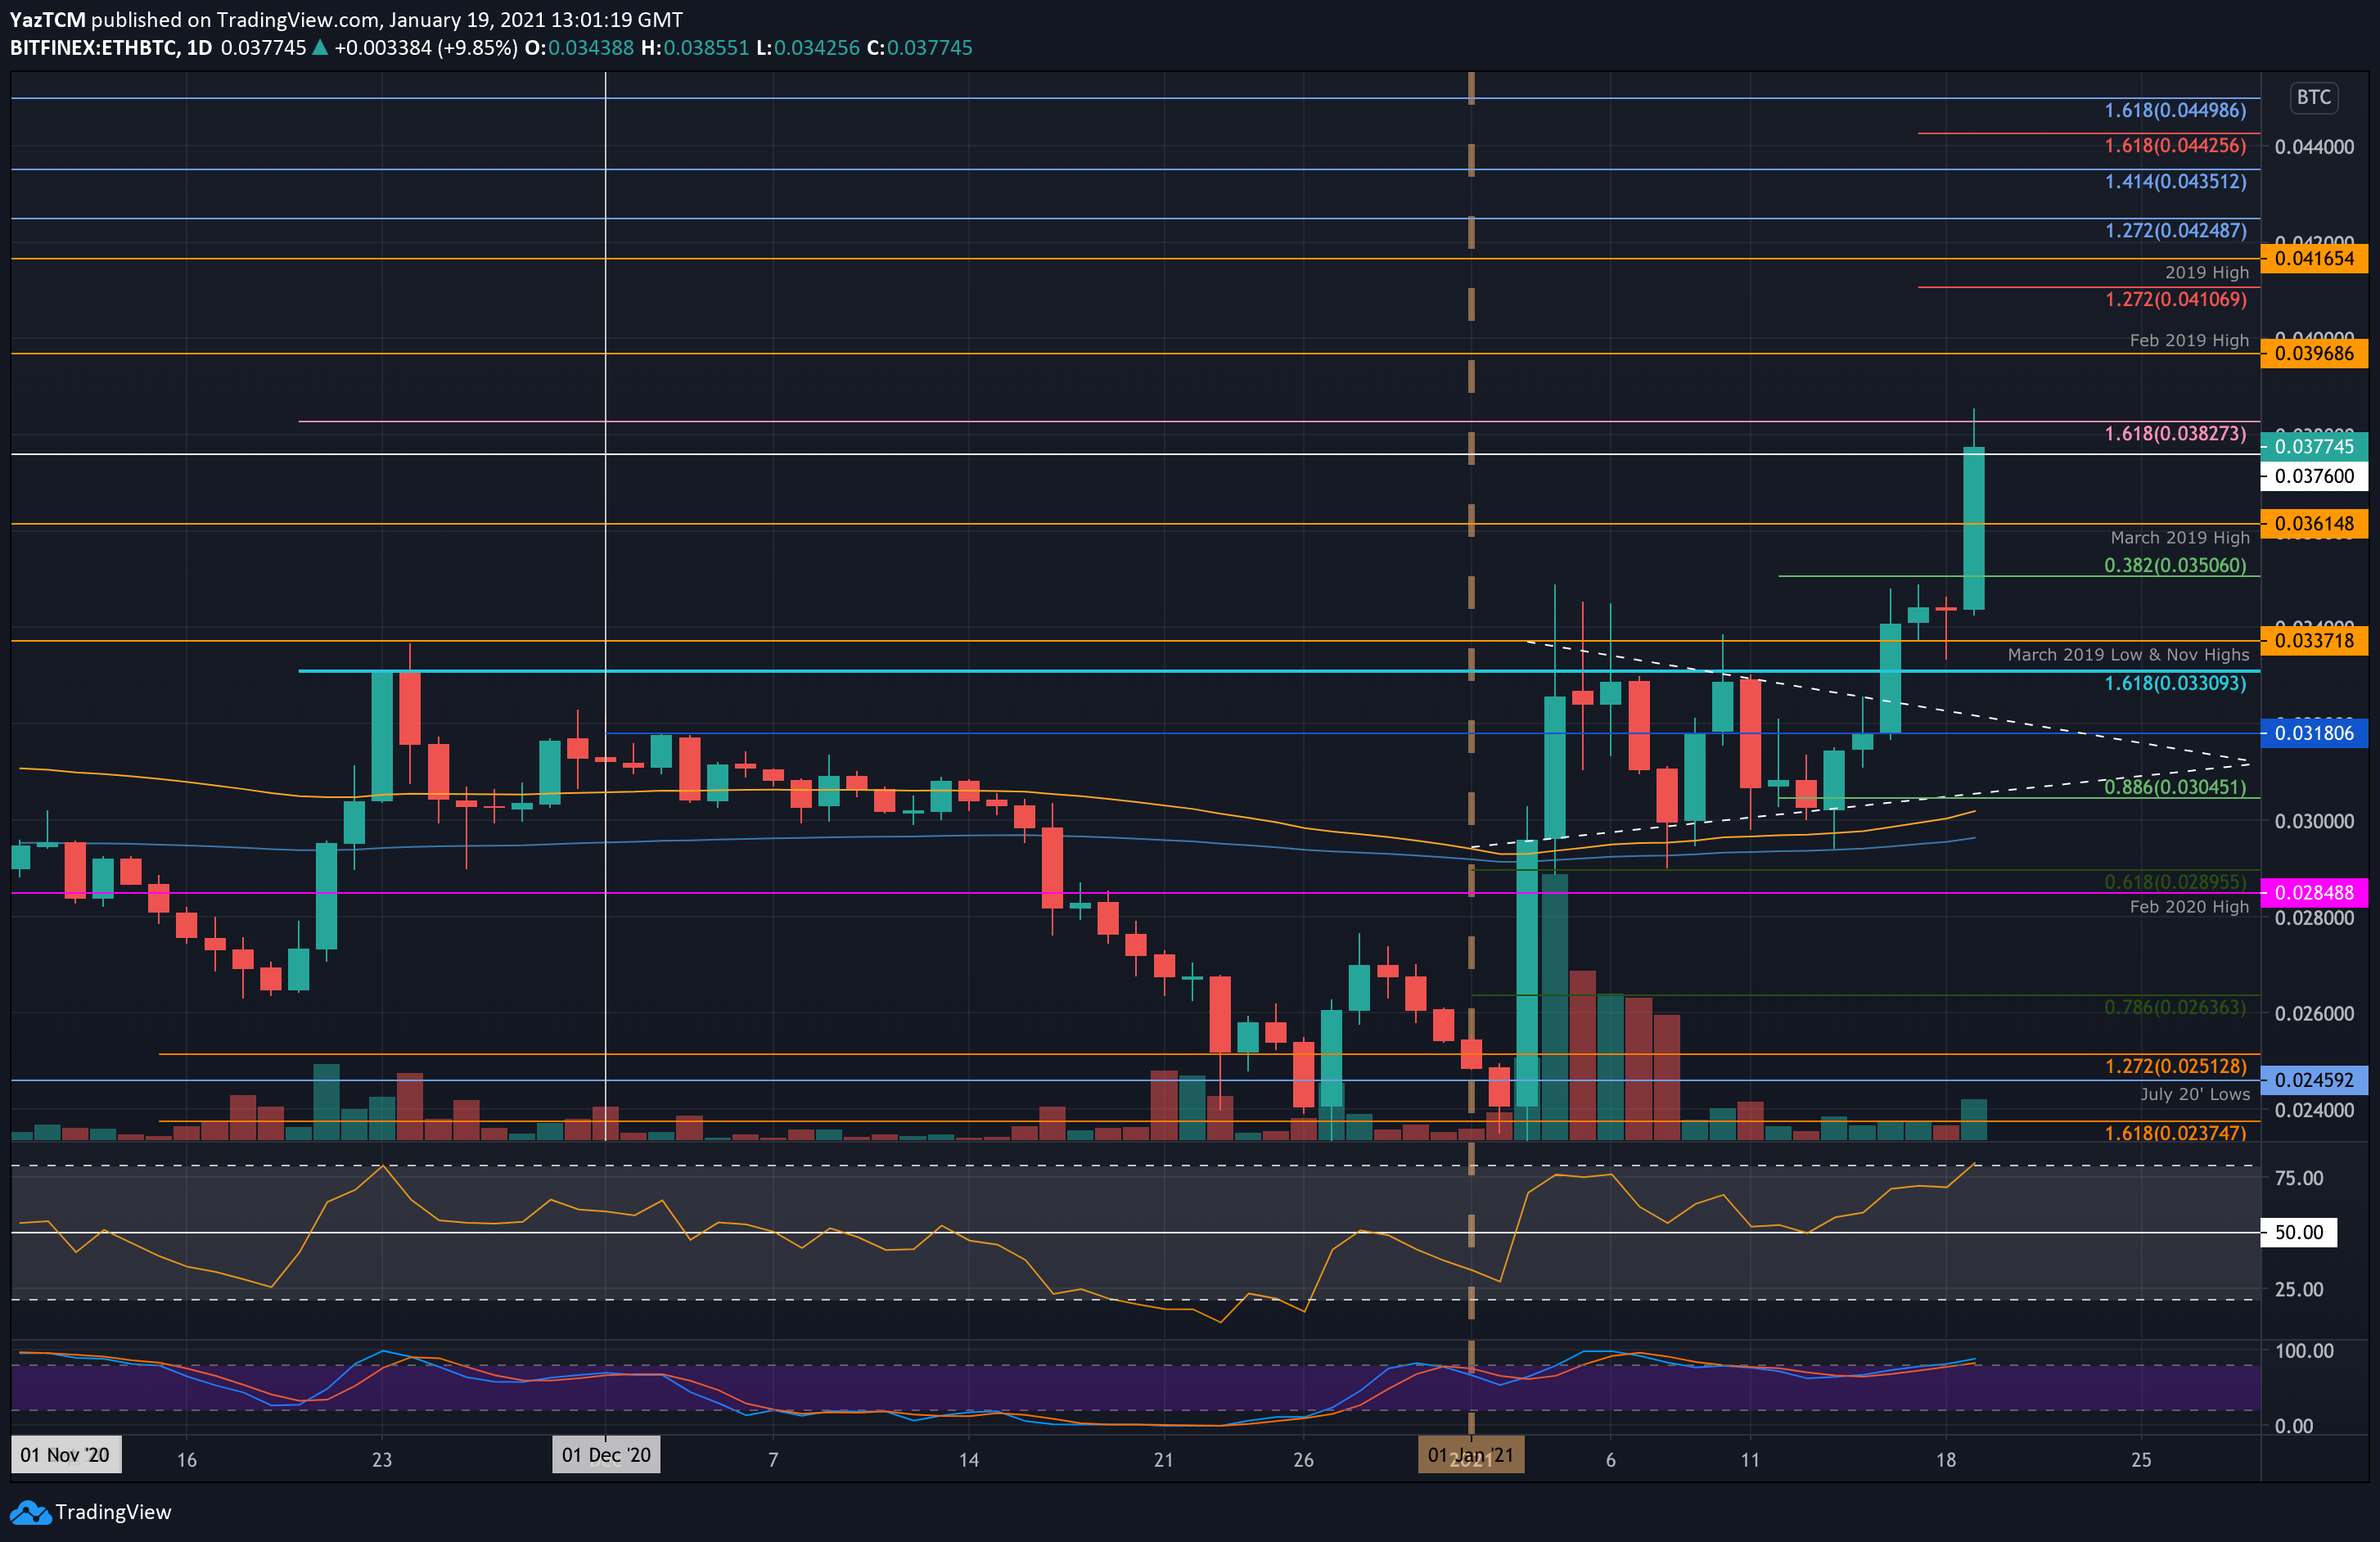
ETH/BTC – Bulls Set Fresh 4-Month Highs
Key Support Levels: 0.0361 BTC, 0.035 BTC, 0.0337 BTC.
Key Resistance Levels: 0.0385 BTC, 0.0396 BTC, 0.041 BTC.
Against Bitcoin, Ethereum finally managed to break resistance at the November 2020 highs over the weekend as it broke 0.0337 BTC to reach 0.035 BTC.
Today, ETH continued higher as it broke above the March 2019 highs at 0.0361 BTC to reach as high as 0.0385 BTC, setting a fresh 4-month high.
ETH-BTC Short Term Price Prediction
Moving forward, if the bulls continue beyond 0.0385 BTC, the first level of resistance lies at 0.0396 BTC (Feb 2019 Highs). Beyond 0.04 BTC, resistance lies at 0.041 BTC (1.272 Fib Extension), 0.0316 BTC (2019 highs), and 0.0428 BTC.
On the other side, the first level of support lies at 0.0361 BTC (March 2019 Highs). This is followed by 0.035 BTC (.382 Fib), 0.0337 BTC (Nov 2020 Highs), 0.033 BTC, and 0.0318 BTC (Dec 2020 Highs).
The RSI is starting to look overbought here but is still not extremely overbought as there is room for the bullish momentum to continue.
PrimeXBT Special Offer: Use this link to register & enter CRYPTOPOTATO35 code to get 35% free bonus on any deposit up to 1 BTC.
Disclaimer: Information found on CryptoPotato is those of writers quoted. It does not represent the opinions of CryptoPotato on whether to buy, sell, or hold any investments. You are advised to conduct your own research before making any investment decisions. Use provided information at your own risk. See Disclaimer for more information.
Cryptocurrency charts by TradingView.