- It has been an amazing week for the cryptocurrency market which stands at an $862 total capitalization.
- Bitcoin price has hit a new all-time high at $34,700 and Ethereum price finally followed blasting through $1,000.
Ethereum was clearly lagging behind Bitcoin but bulls have finally managed to push the smart-contracts giant to new highs above $1,000. The ETH/BTC chart exploded by around 52% indicating that Ethereum is gaining a lot of momentum.
Ethereum price hits $1,162 and aims for a new all-time high
Ethereum had a massive 60% rally in just 48 hours hitting a high of $1,162 and remains trading at $1,027 at the time of writing. It seems that Ethereum is finally catching up to Bitcoin which has been posting new all-time highs almost every single day.
ETH/BTC daily chart
On the daily chart of the ETH/BTC chart, there is a clear uptrend established after a massive spike in the past 48 hours. This is the first time we see an uptrend since July 2020. However, we still need to see more continuation.
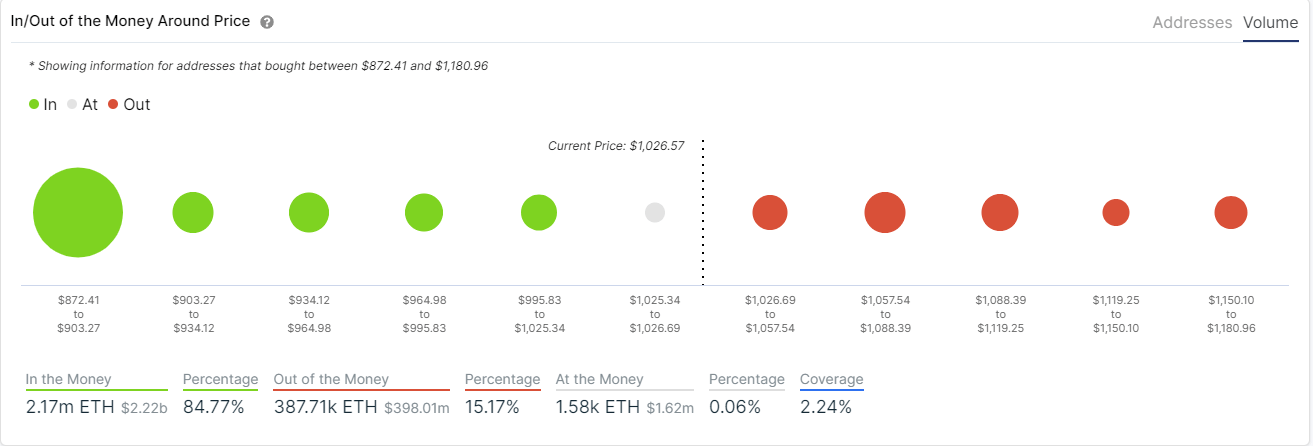
ETH IOMAP chart
The In/Out of the Money Around Price (IOMAP) chart shows very little resistance to the upside above $1,000. With the current momentum, it seems that Ethereum price can easily climb back towards $1,180 and aim for a new all-time high.
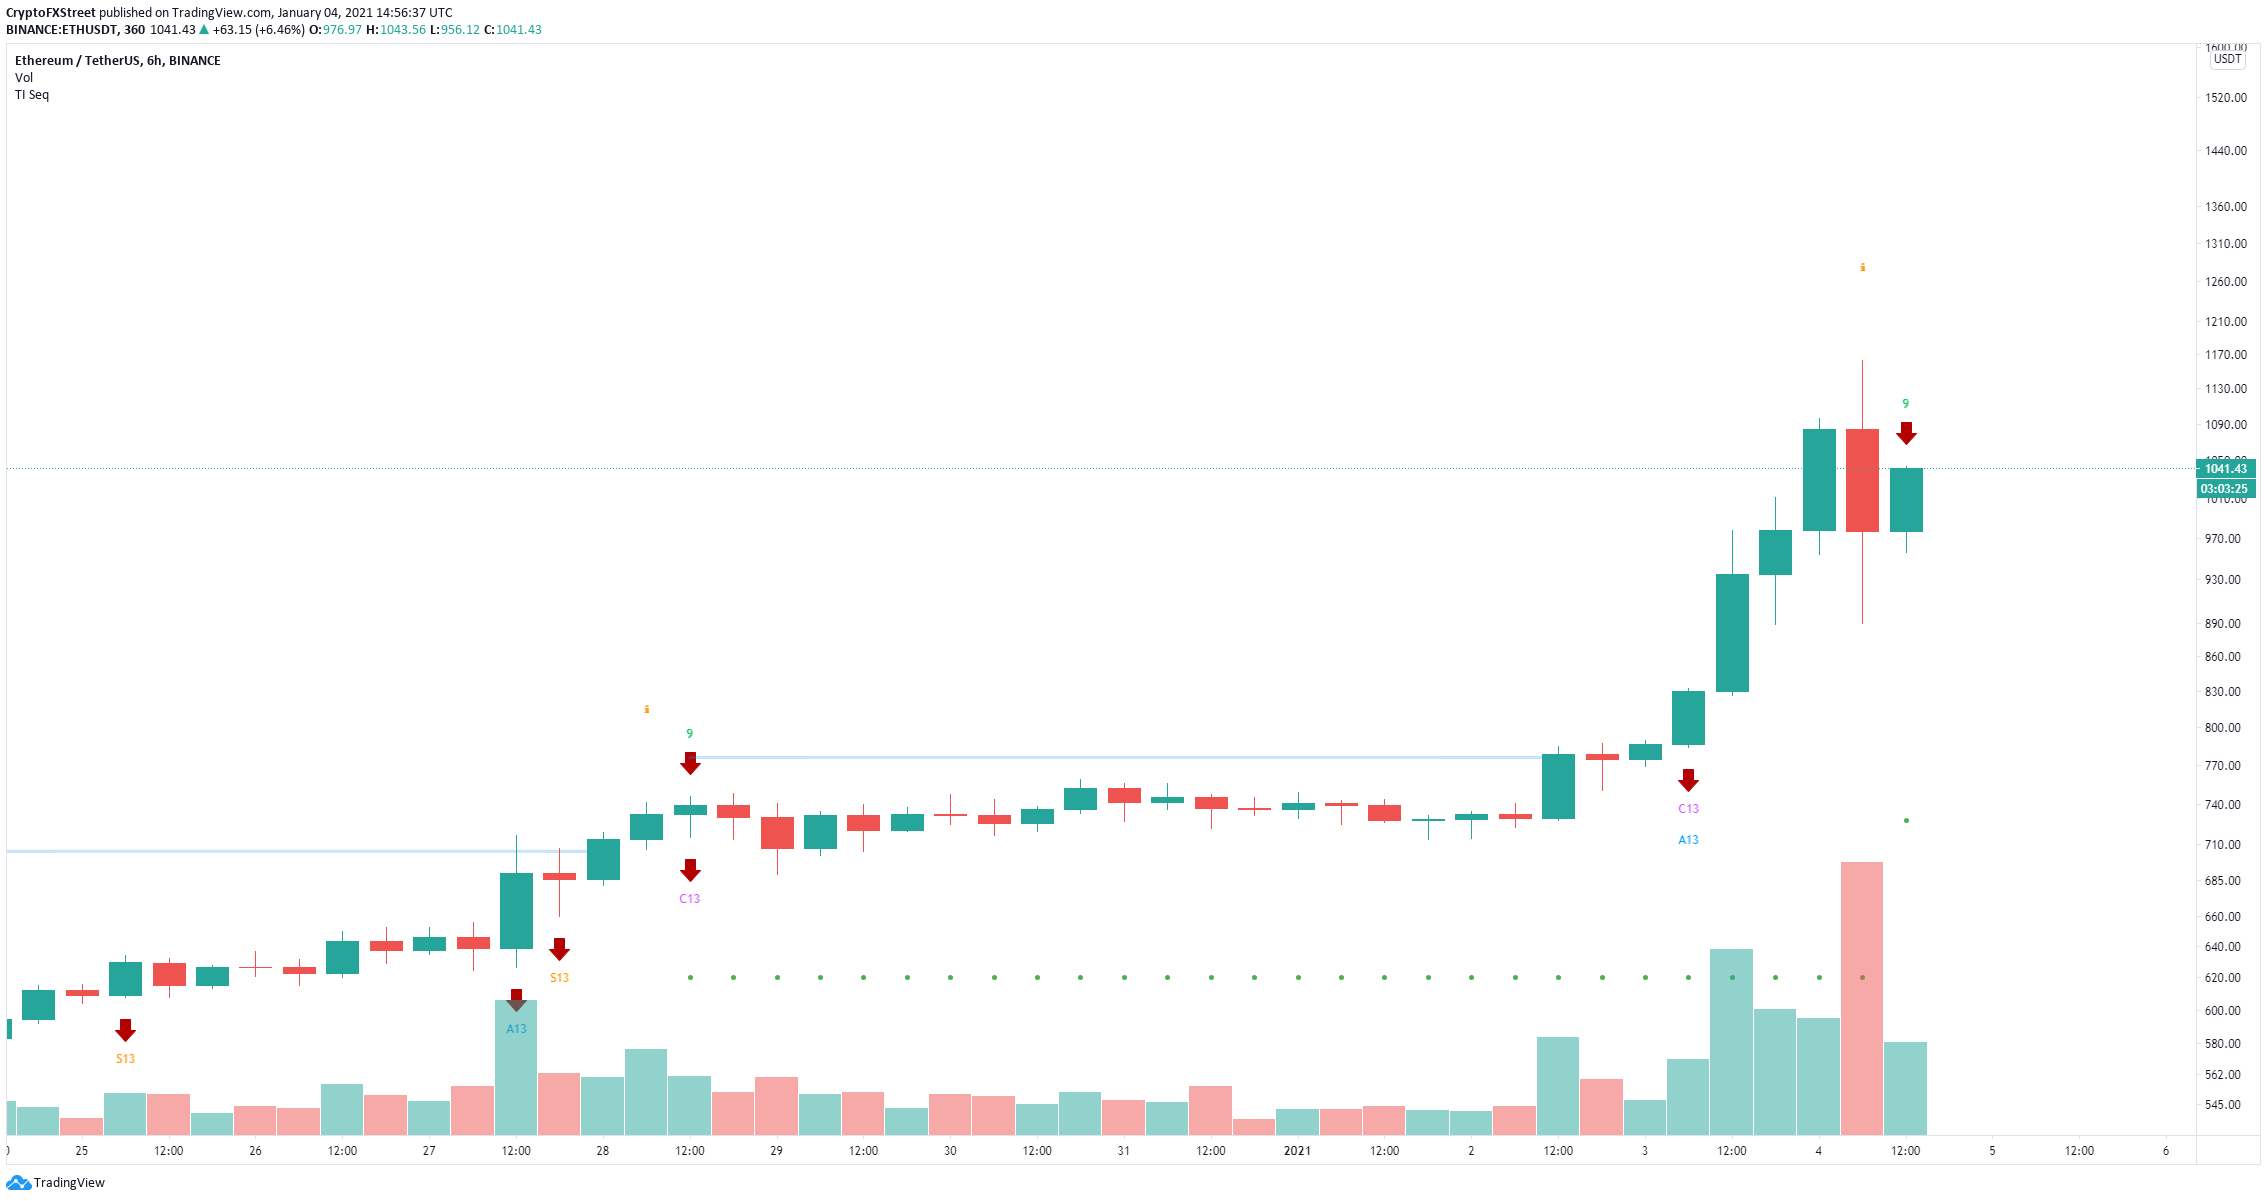
ETH/USD 6-hour chart
However, the IOMAP chart also shows low support on the way down until the significant area between $872 and $903. This point combined with the sell signal presented by the TD Sequential indicator on the 6-hour chart would suggest that Ethereum price is at risk of falling towards $900 if the signal is confirmed.
Bitcoin price continues with its unstoppable rally
Bitcoin has hit a new all-time high at $34,778 and despite the most recent sell-off towards $28,130, the digital asset has recovered quickly and is trading at $32,000 again.
BTC Holders Distribution
Surprisingly, the number of whales holding between 1,000 and 10,000 BTC ($32,000,000 and $320,000,000) has increased significantly in the past week from 2,128 to 2,191 currently, despite Bitcoin price hitting new highs. This indicates that whales are ready to hold and expect the price to continue rising.
BTC MVRV(30d) chart
However, the MVRV chart shows Bitcoin price is in the danger zone which usually indicates the digital asset is about to see a major pullback. Nonetheless, investors should remain extra careful as the volatility is extreme.
XRP price has trouble recovering and remains weak
The SEC has sued Ripple arguing that XRP is a security. Since the announcement, XRP price dropped by 70%, and although it has recovered a bit, it is still down by 61%. Most analysts believe XRP price will continue to decline or remain flat until there is a clear decision by the SEC, which could take months.
This can be extremely detrimental to XRP because most top cryptocurrencies are rallying. Investors might end up shifting their money from XRP to others as the digital asset remains in a downtrend or flat.
XRP Holders Distribution chart
The XRP Holders Distribution chart seems to add credence to the theory above as the number of whales with at least 10,000,000 coins has massively dropped from 356 on December 25 to a low of 308. This indicates that large holders are exiting their XRP positions, most likely to invest in other coins.


%20[16.07.00,%2004%20Jan,%202021]-637453699560292921.png)
%20[16.06.29,%2004%20Jan,%202021]-637453699679250335.png)
%20[16.11.21,%2004%20Jan,%202021]-637453699747721612.png)