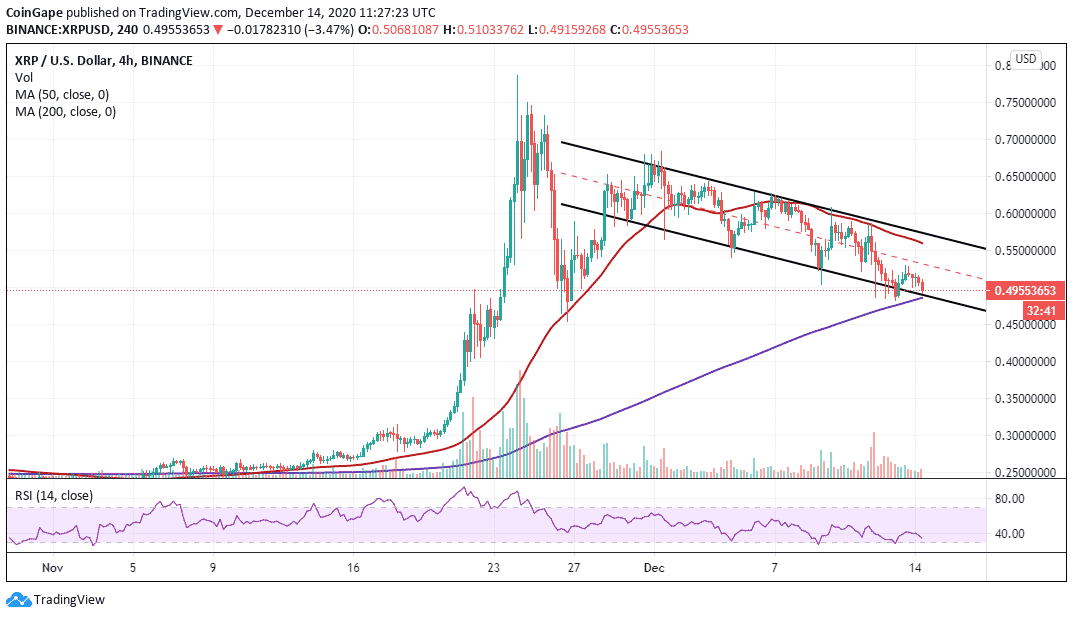
- Ripple is on the verge of a breakdown to $0.4 if support at the 200 SMA on the 4-hour chart caves.
- XRP/USD is likely to invalidate the downtrend if it closes the day above $0.5 or the 200 SMA.
Ripple is trading under intense overhead pressure, risking a massive freefall back to $0.4. Losing the support at $0.4 was a blow to the progress XRP had made in November. For now, the path of least resistance is downwards, as seen on the 4-hour chart.
The lower boundary of the descending parallel channel appears to be holding the fort for the bulls. However, the Relative Strength Index has reinforced the ongoing bearish momentum. If the indicator hits the oversold area, selling orders are likely to increase significantly.
The 200 Simple Moving Average on the 4-hour chart is also in line to offer immediate support, and buyers must hold this crucial support. Otherwise, XRP/USD could tumble to $0.4 (next tentative support area).
XRP/USD 4-hour chart

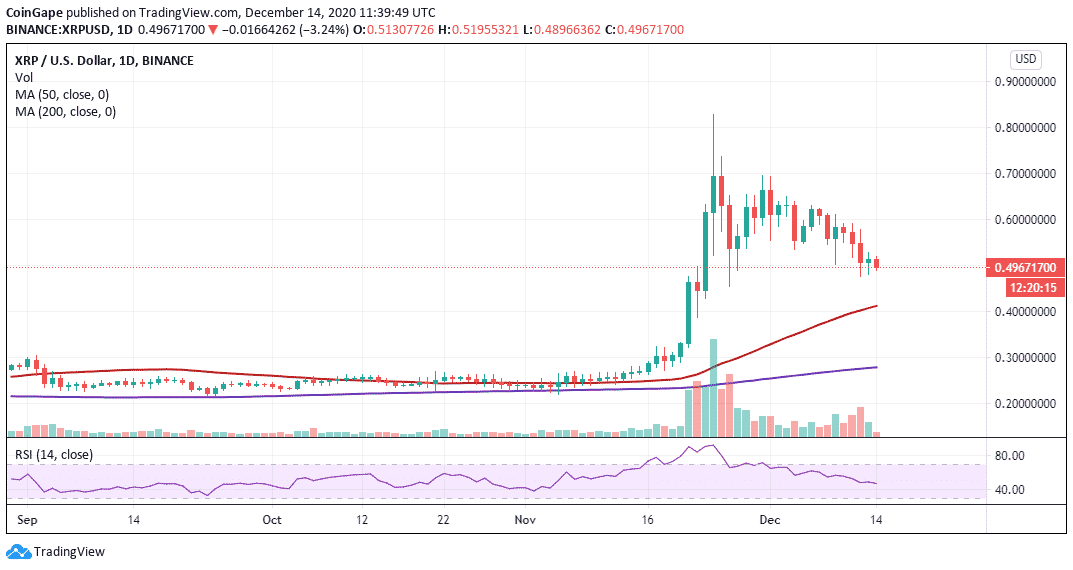
The daily chart also confirms the bearish outlook, suggesting that the next critical support lies at the 50 SMA. Similarly, the RSI is in a sloping motion but has not hit the oversold area yet. This could mean that XRP bears still have enough room to explore before recovery comes into play.
XRP/USD daily chart

On the other hand, the bearish picture will be invalidated if Ripple closed the day above $0.5. Moreover, the support at the channel’s lower boundary as well as the 200 SMA on the 4-hour would secure the uptrend if they remain intact. The most significant upward movement for XRP would be to overcome the hurdle of $0.6.
Ripple intraday chart
Spot rate: $0.495
Relative change: -0.02
Percentage change: -3.4%
Trend: Bearish
Volatility: High
To keep track of DeFi updates in real time, check out our DeFi news feed Here.


Share on Facebook
Share on Twitter
Share on Linkedin
Share on Telegram