- Litecoin spikes above $100 and even extended the bullish leg past $110 as the crypto bull run catches momentum.
- A correction seems imminent following the resistance at $110; downside eyes $90 before another majestic recovery.
Litecoin has hit highs above $100 for the first time since its halving in 2019. The coin sprung higher to test the seller congestion at $100. In the meantime, a correction seems imminent before LTC makes a gigantic spike to $140.
Litecoin struggles to keep the uptrend intact
The cryptocurrency market is generally bullish, and so is Litecoin. However, LTC/USD is has hit a wall at $110. If the price fails to close the day above $110 (note that LTC is exchanging hands at $108), the price might correct under $100.
Tentative support is envisaged at the 61.8% Fibonacci level taken from the last swing high of $113 to a swing low at $52, precisely around $90. The Relative Strength Index is overbought, which supports the bearish outlook.
LTC/USD daily chart
More buyers are expected to come into the market around $90 (lower price entry-level). Enough volume may well catapult Litecoin back to levels above $110 and push it to $140.
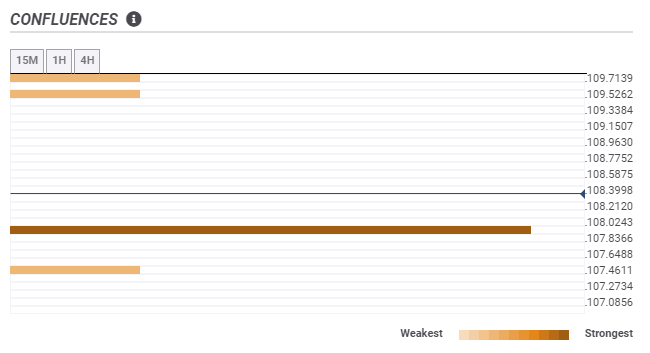
LTC/USD confluence levels
It is worth mentioning that LTC/USD confluence levels highlight $108 as the most robust support area. The buyer congestion zone is home to the 1-hour previous low. The path ahead of LTC is smooth, and if demand for LTC builds, a breakout to the same target at $140 may come into the picture soon enough, invalidating the call to refresh support at $90.
LTC/USD daily chart
A bullish formation on the same daily chart occurred after Litecoin spiked past the triangle pattern’s horizontal resistance. In other words, retesting the support at $90 will not throw the bullish case out the window. Litecoin will still be on the growth path to price levels between $140 and $150.


%20(20)-637438615832757886.png)