- Litecoin price was on the verge of hitting a new 2020-high in the past 24 hours.
- It seems that most of the price action is coming from large investors.
Litecoin seems to have broken out of an ascending triangle pattern on the 3-day chart aiming to hit $300 in the long-term. Several on-chain metrics indicate that large investors are driving the price currently.
Litecoin eying up $300 as several metrics turn extremely bullish
On the 3-day chart, the breakout above the ascending triangle pattern is an extremely bullish signal and has a potential price target of $300, a 248% price increase derived from the height of the pattern.
LTC/USD 3-day chart
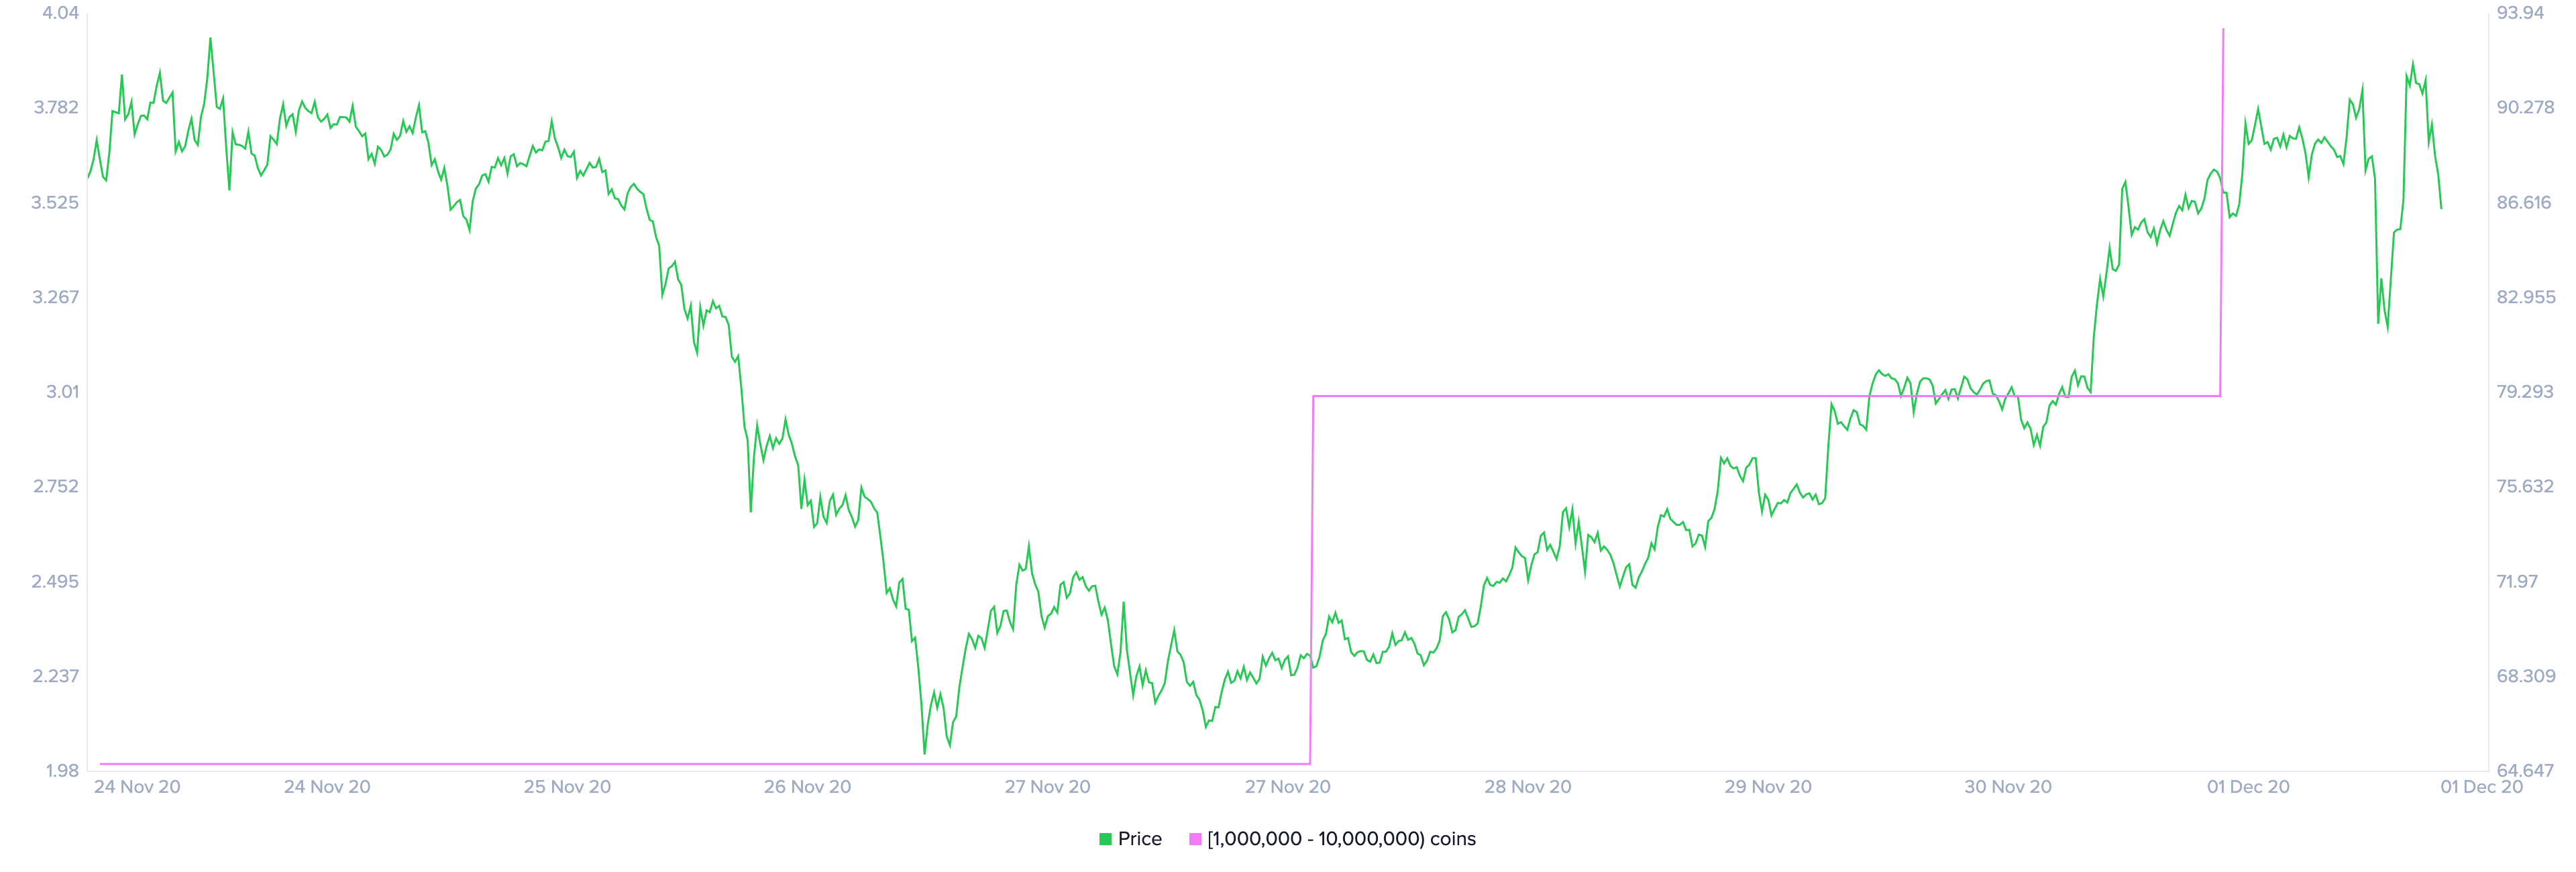
Furthermore, it seems that the number of whales holding between 1,000,000 and 10,000,000 coins ($89,000,000 and $890,000,000) has increased by two in the past week. Although this might seem like a small number of investors, the sum of money is considerably high.
Litecoin Holders Distribution chart
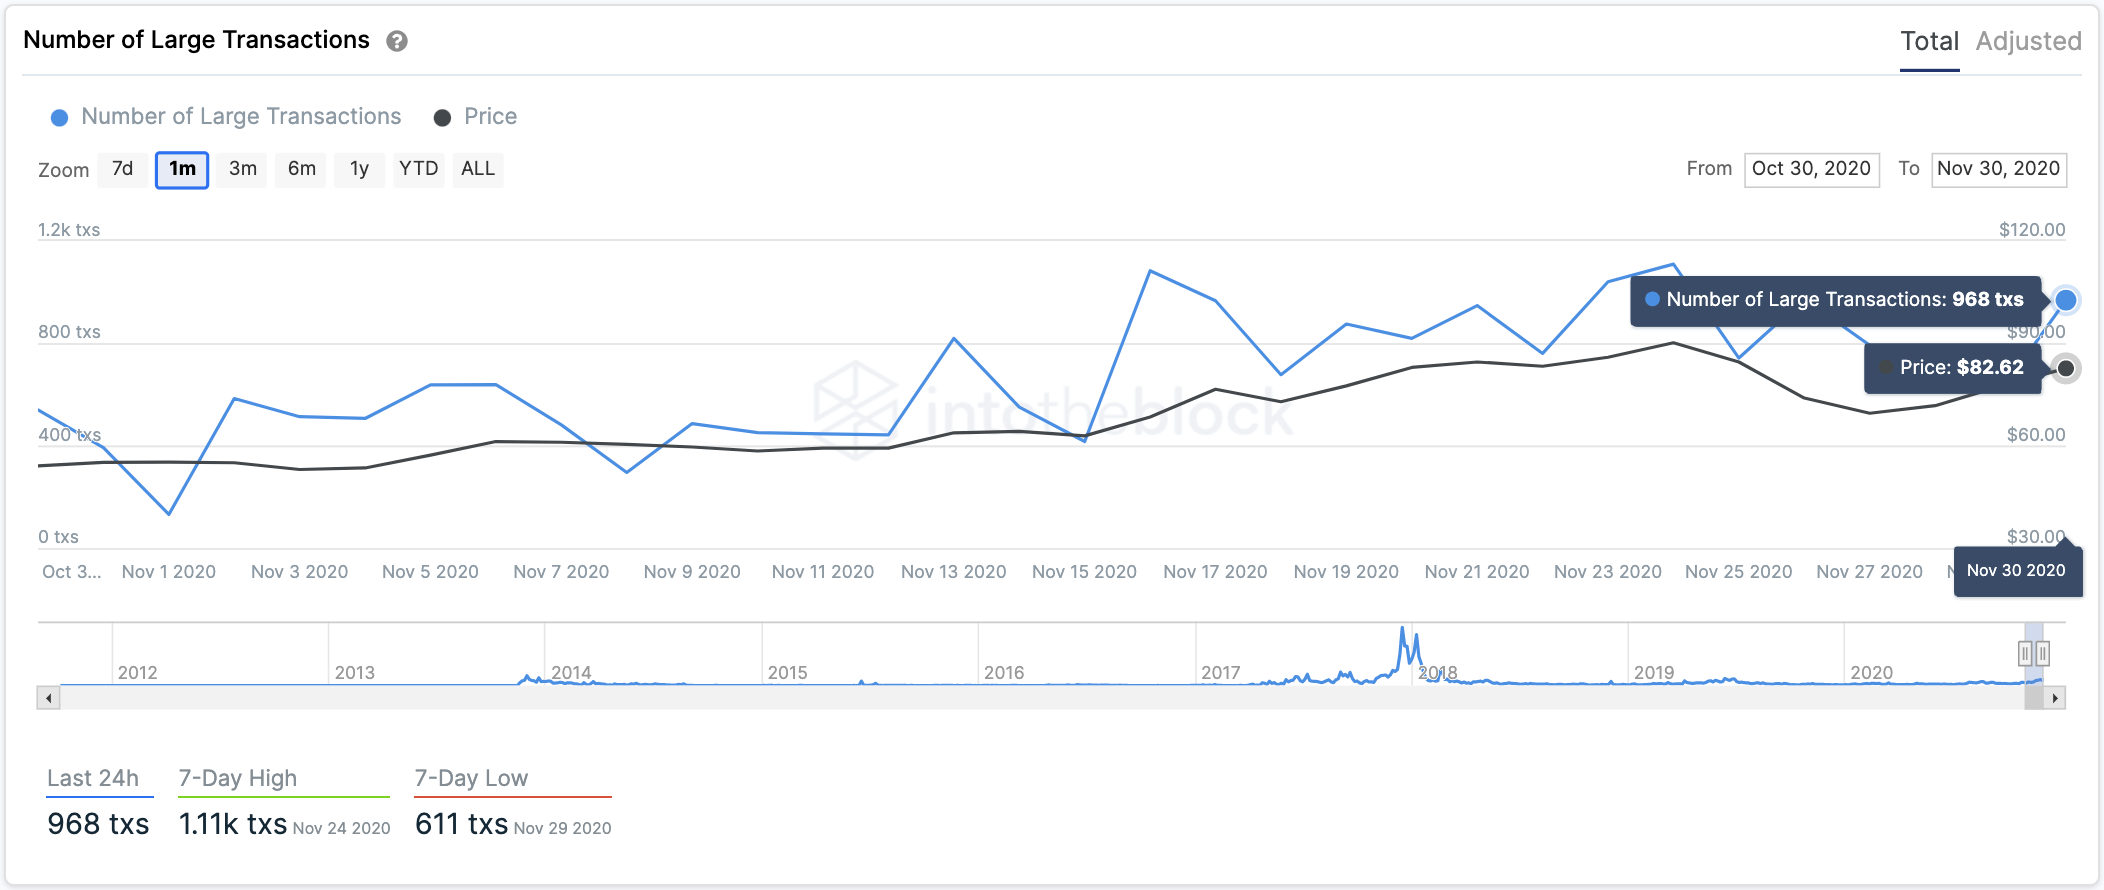
The continuous increase in the number of large LTC transactions seems to corroborate this theory that large investors are the ones driving Litecoin price which remains considerably stronger than many other altcoins.
LTC Large Transactions chart
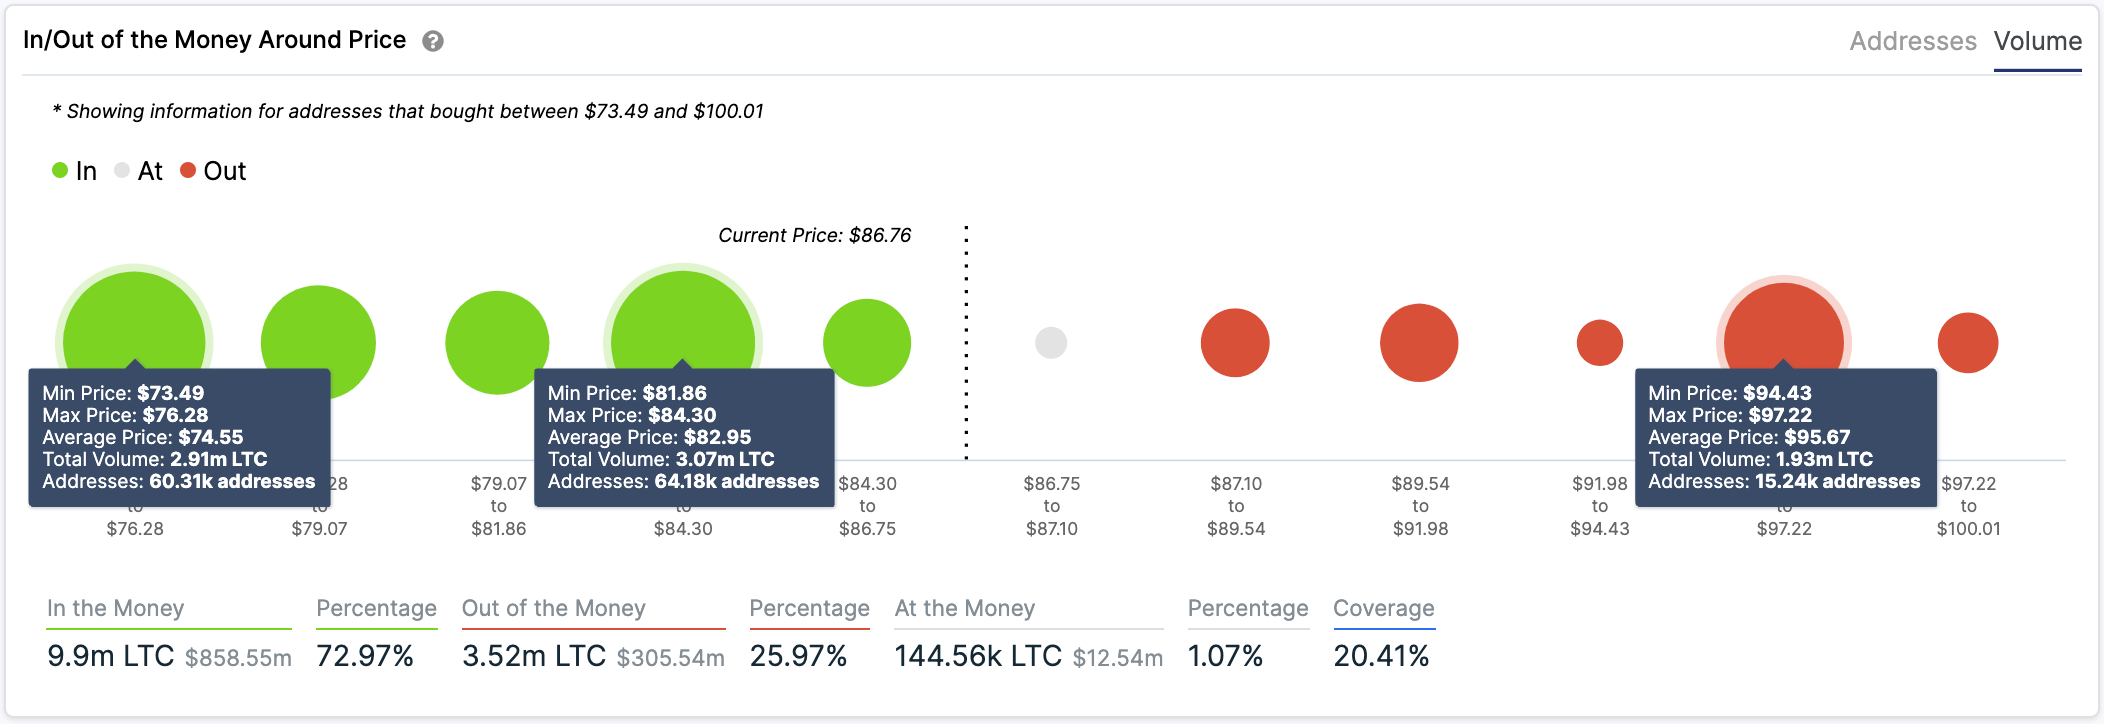
The In/Out of the Money Around Price chart shows only one significant resistance area between $94 and $97 where 15,240 addresses purchased around 1.93 million LTC. On the other hand, the chart shows a lot of support to the downside.
LTC IOMAP chart
It seems that climbing above $97 would be the final confirmation of the breakout above the ascending triangle pattern on the daily chart.
On the other hand, a rejection from the upper trendline of the pattern at $84 would be a notable bearish indicator capable of pushing Litecoin price down to the lower boundary at around $55. A breakdown from this point could be devastating.


