The technical picture for Litecoin (LTC) suggests that it could post a massive upside towards $100 if bulls hold above $70
Litecoin’s spot price mirrors the rest of the top altcoin market, with LTC changing hands around $70 after dipping more than 6% in the past 24 hours. The cryptocurrency is also trading nearly 18% down over the past seven days.
At the moment, Litecoin bulls are trying to keep bears at bay around the critical $70 support level. If they manage to flip momentum to their side, increased buy pressure could see LTC price rise to $80. Above this price level, bulls could aim at $100.
On the contrary, a continuation of the breakdown observed over the past two days could see Litecoin slide to lows of $65.
Litecoin price: technical outlook
LTC/USD has recently broken below the 50-SMA ($81.02) and 200-SMA ($75.72) on the 4-hour chart.
The Relative Strength Index (RSI) shows the cryptocurrency is currently trending oversold, but with a hidden bullish divergence.
LTC/USD 4-hour chart. Source: TradingView
While bears appear on top of the action short term, the technical perspective suggests a bullish flip is the next immediate direction for LTC/USD.
The above 4-hour chart shows that Litecoin is near the tip of a descending wedge pattern. The pattern’s formation indicates that bulls are likely to see a major breakout. If the scenario plays out as expected, recovery to the 200-SMA ($75.72) and 50-SMA ($81.02) could leave bulls eyeing the psychological level of $100.
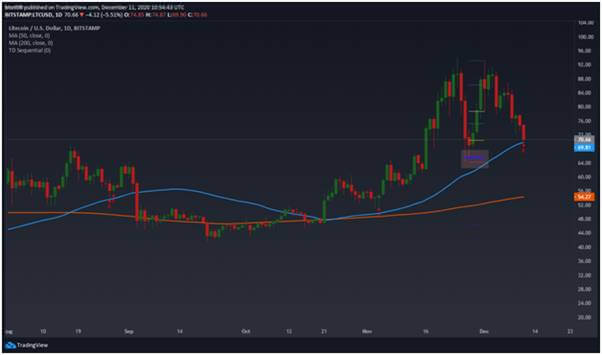
 LTC/USD daily chart. Source: TradingView
On the daily chart, LTC/USD is just above the 50-SMA (69.81), which is critical if bulls are to prevent further losses. However, the potential for a major downside is unlikely given the gap to the 200-SMA ($54.27). This suggests that bulls are likely to absorb the immediate downward pressure and thwart bears’ desire for more blood.
The possibility of a bullish flip will increase if a potential buy signal appears in the next trading session. Currently, the daily TD Sequential indicator has printed a red eight candlestick and the appearance of a red nine could signal an influx of upside pressure.
Upward action for LTC bulls will face slight resistance at the 61.8% Fibonacci retracement level ($75.22). A break above this hurdle would see bulls confront resistance at the 23.6% Fibonacci retracement level ($86.26).
If bulls fail to hold prices above $70, a drop to $65 is likely. As shown on the daily chart, the level could provide for a double bottom pattern.
