- Ethereum price seems close to complete a bearish pattern known as Adam & Eve.
- Bears will target a low of $370 in the long-term if the pattern is confirmed.
- More than 1.4 million ETH are locked inside the ETH2 deposit contract.
Ethereum is trading in a short-term downtrend on the daily chart at $545 at the time of writing. While bears target a breakdown below a crucial support level at $484, bulls are not entirely afraid as more than 1.4 million ETH have been deposited inside the Eth2 contract already, and the number continues rising.
Ethereum price faces mixed signals in the short-term
On the daily chart, Ethereum seems to have formed an Adam and Eve pattern, which is considered extremely bearish. The support trendline would be at $484. A breakdown below this point can quickly drive Ethereum price towards $370.
ETH/USD daily chart
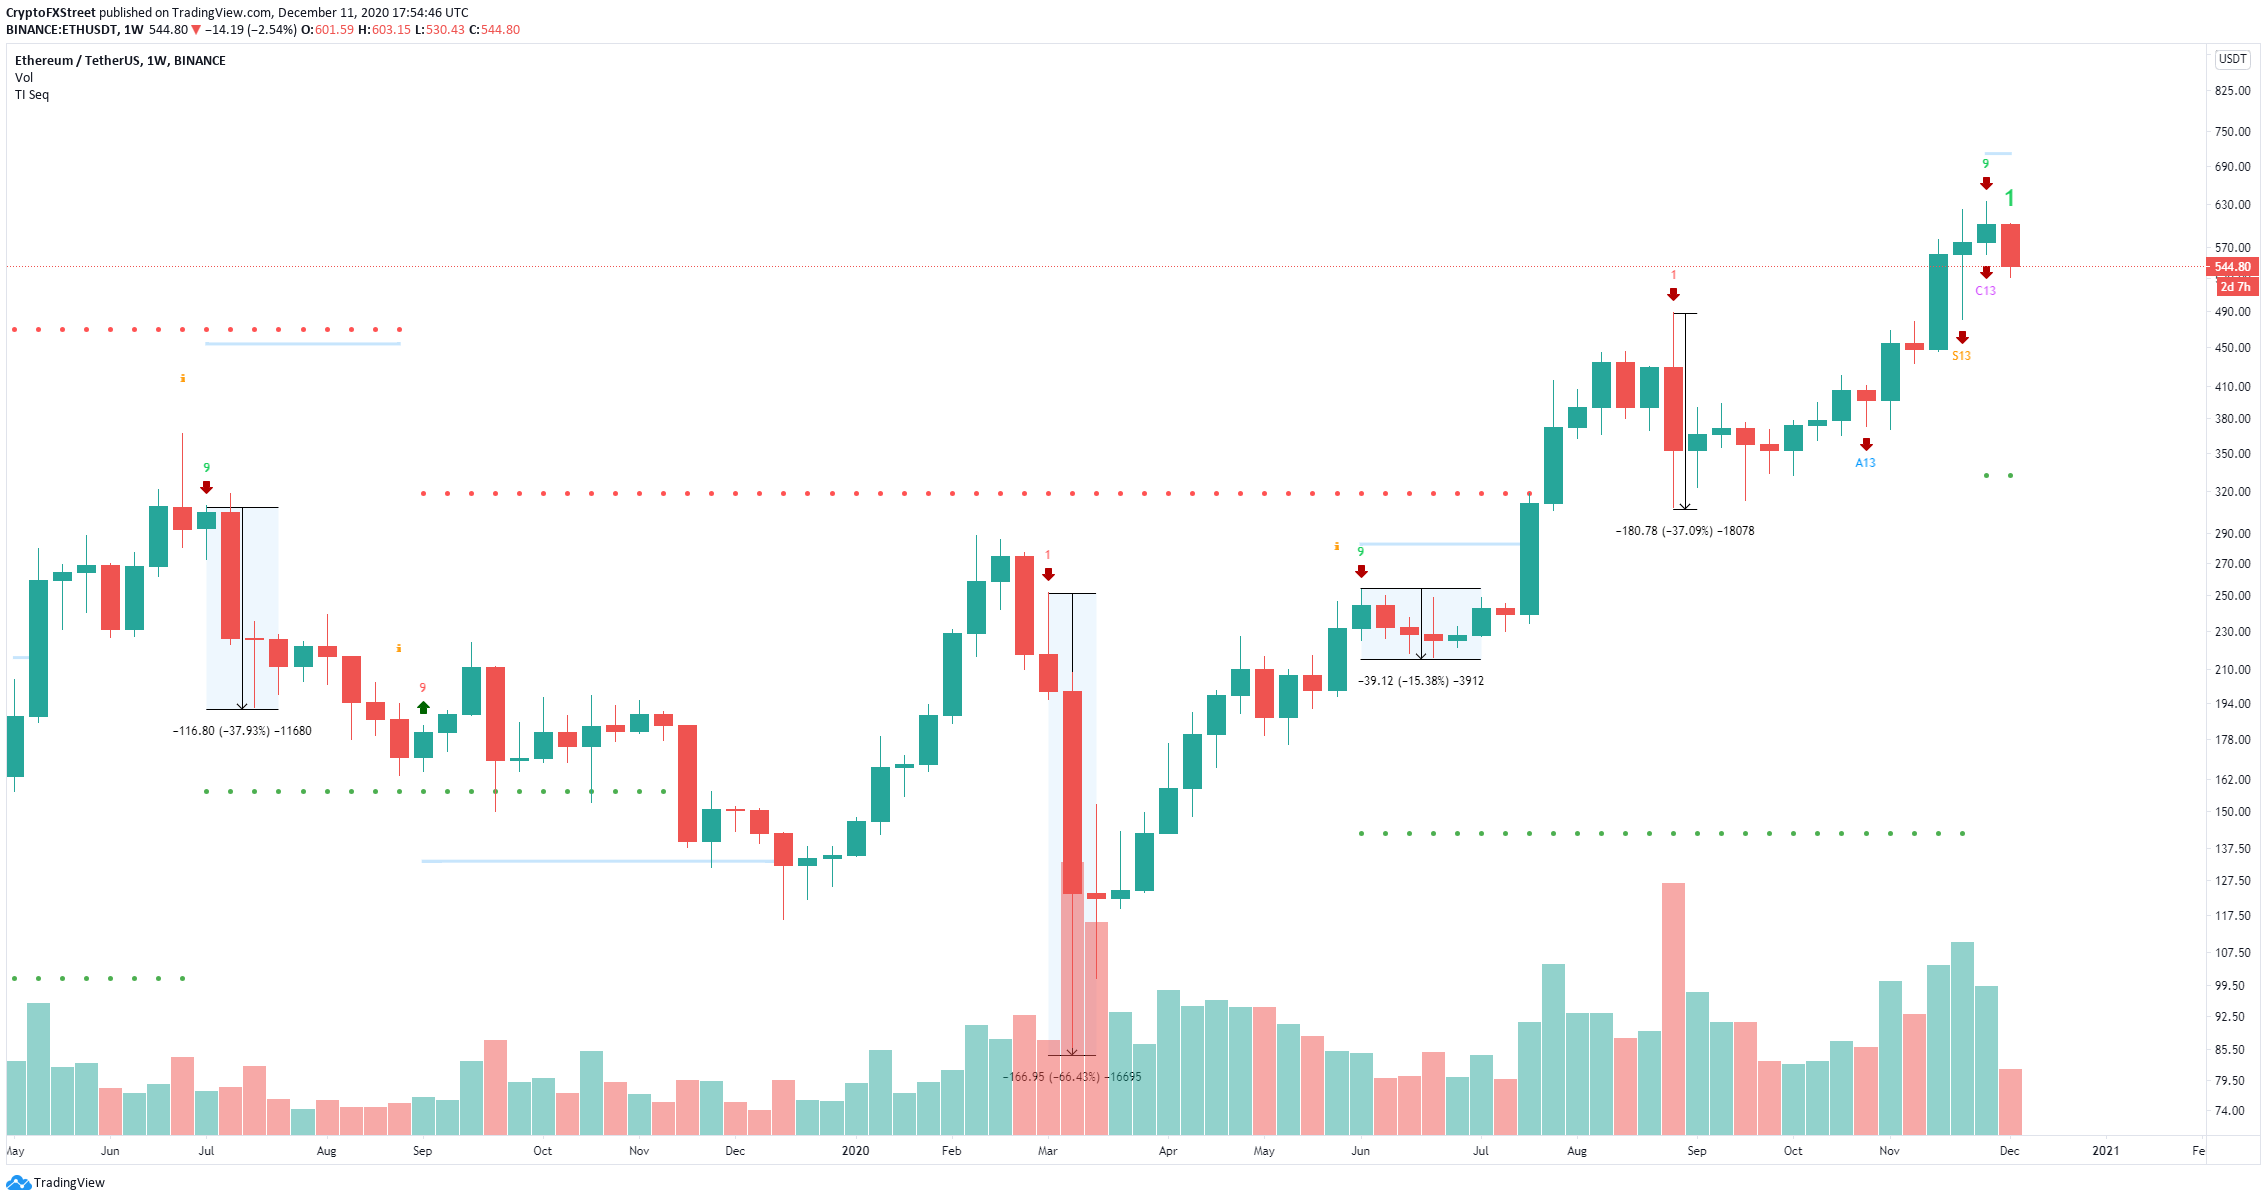
Additionally, on the weekly chart, the TD Sequential indicator presented a sell signal in the form of a green nine candle on the week that started on November 30. The call seems to be getting enough continuation as Ethereum price is down 12% in the current week.
ETH/USD weekly chart
On the other hand, as more Ethereum is deposited inside the Eth2 contract, fewer coins are circulating. So far, 1.23% of the total supply of ETH has been locked inside the contract, a notable sum of money worth around $764 million at current prices.
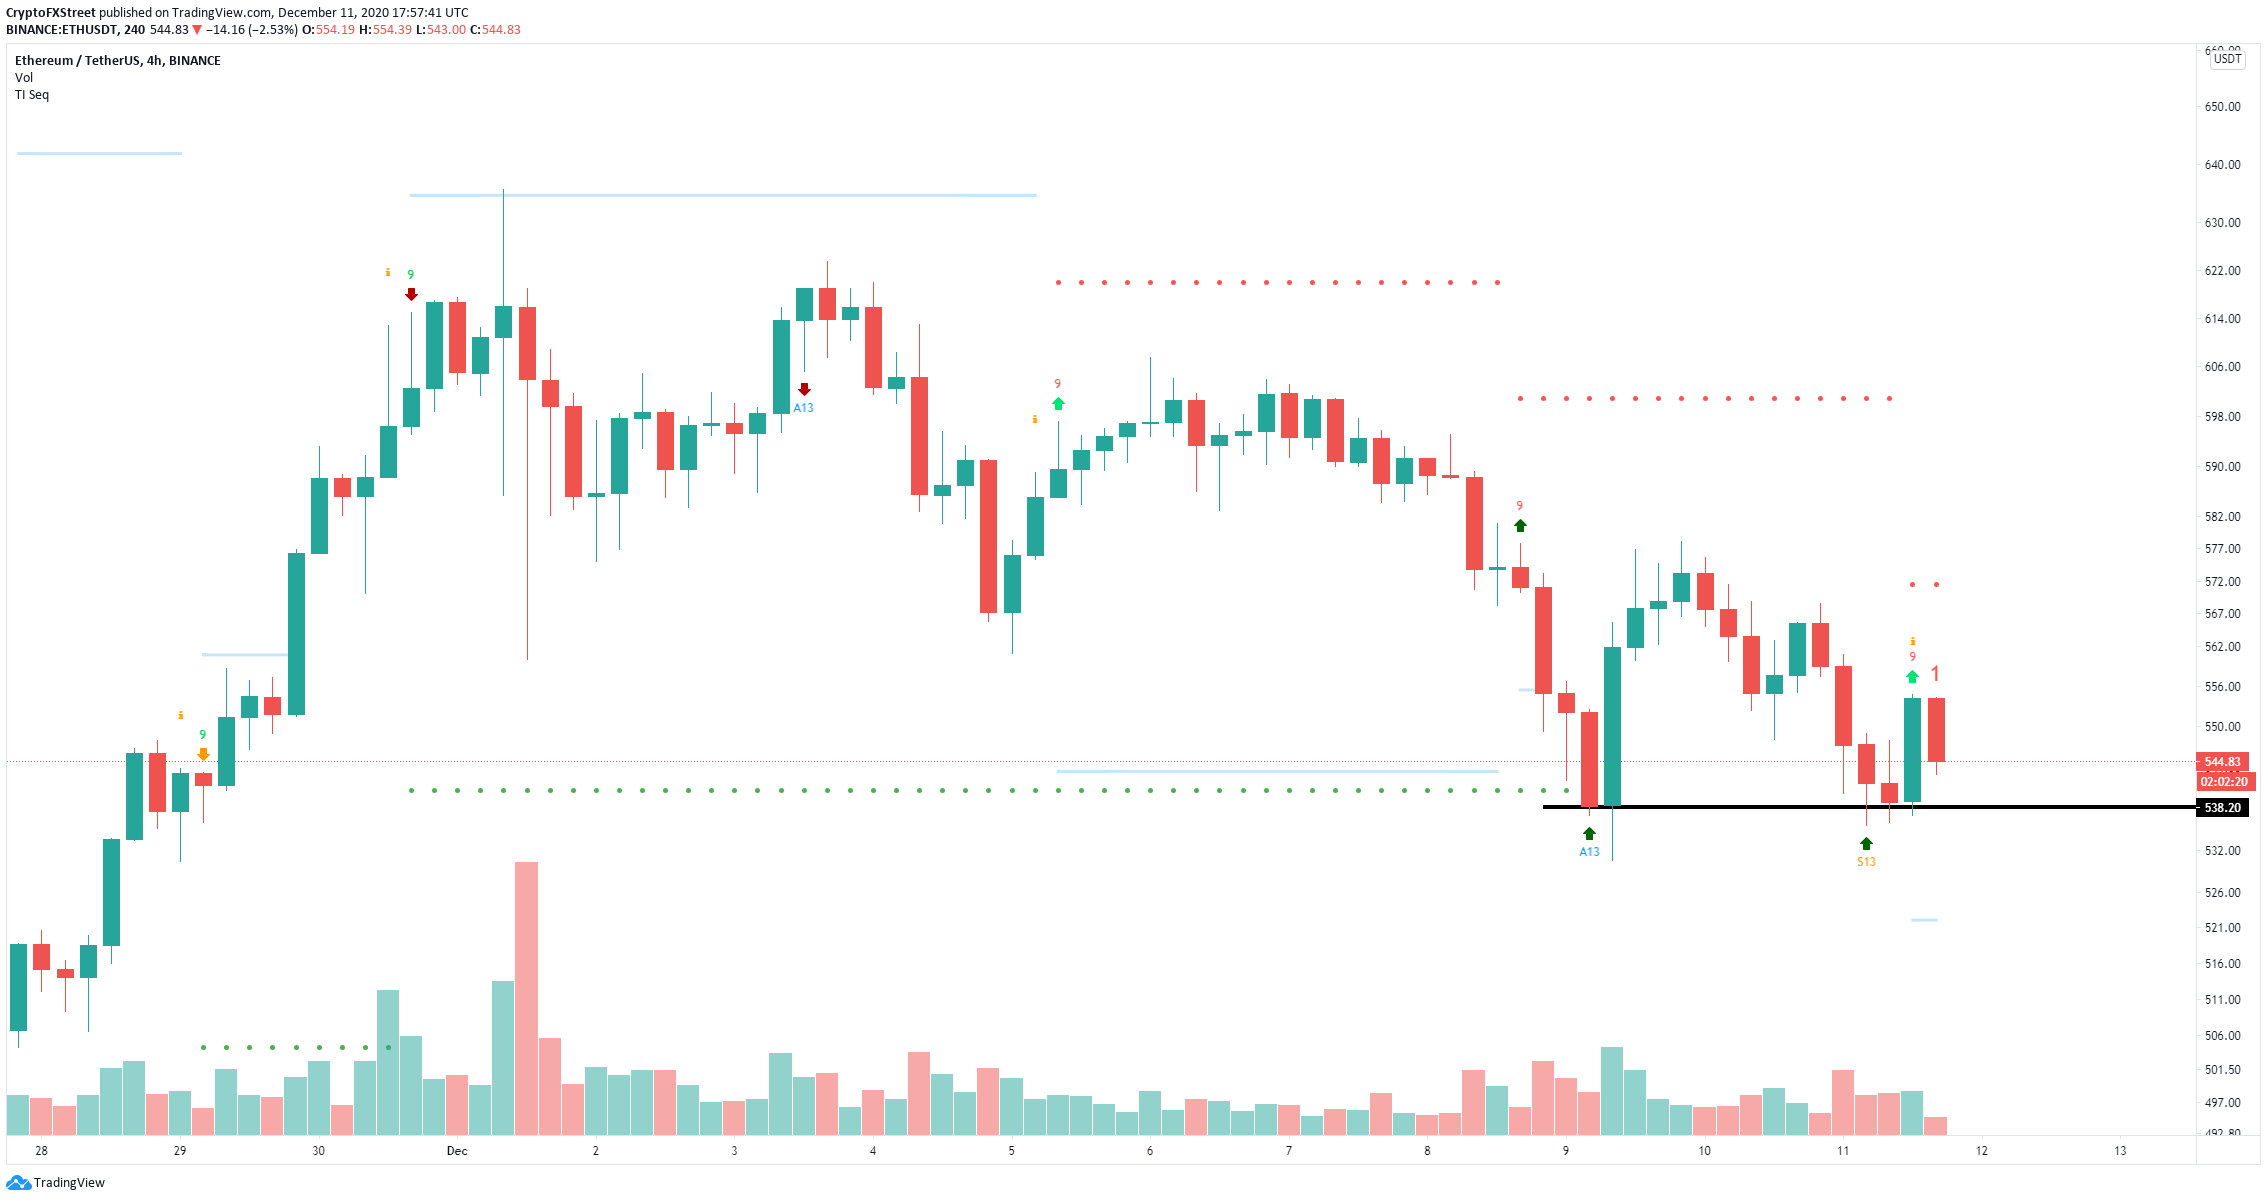
ETH/USD 4-hour chart
Additionally, on the 4-hour chart, bulls have defended a significant support level at $538, and the TD Sequential indicator has just presented a buy signal in the form of a red nine candle. The next price target for the bulls seems to be the December 9 high at $578.


