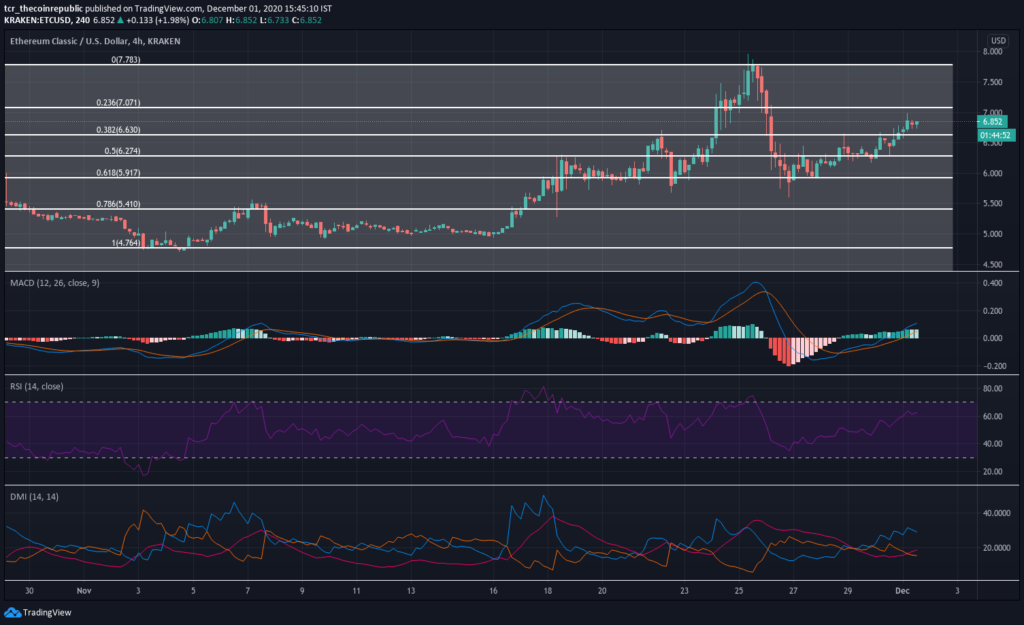
- Ethereum classic, after touching a major support level of $5.50, was able to revive its positive momentum and had a positive crossover above $6.00
- The price levels are currently targeting the bullish and resistance mark of $7.00
- The ETC/BTC pair is also performing positive while having a gain of 0.755, bringing the current level to 0.00034740 BTC
ETC’s weekly price performance chart highlights the sharp negative divergence faced by the price levels after retesting the critical resistance zone around $8.00. The negative trend bought the price levels to a significant support level of $5.50 on the downside. The support level did help the price levels to regain the positive momentum supported by positive sentiment prevailing in the overall market conditions at the same time. The CMP is placed at $6.82, having a significant overall gain of 7.845, bringing the market capitalization to $796,455,694 and the 24-hour volume traded to $1,507,774,376. The current positive move of the coin is also supported by the positive performance of the ETC/BTC pair.
Technical Levels Showing no Signs of Retracement for a Positive Crossover Above $7 for ETC

ETC’s technical chart highlights sideways movements of the price levels through the sharp negative divergence after reaching the critical resistance zone and the positive bounce back after touching lower levels. The price levels have currently given a positive crossover above the 0.382fib level and will be looking to develop sustainability above the region.
The moving average convergence & divergence (MACD) also had a bullish crossover and currently showed no retracement signs.
The relative strength index (RSI) levels are also moving positively and firmly targetting for the overbought region. The current level stands at 62.10.
The directional movement index (DMI) is also recovering the levels as ADX(18.81) managed to have a positive crossover against -DI(15.56).
Will ETC be Able to Retest $8.00 With Current Positive Move?
The technical levels and the overall market conditions are currently favoring ETC bulls. However, the price levels might face slight retracement around $7.00 (0.236fib level). If the chart develops clear green candles above the mentioned fib level, we might expect the coin to retest the bullish and resistance mark of $8.00 again.
Resistance level: $7.00 & $8.00
Support level: $5.90 & $5.50
