- Bitcoin touches pivotal $24,000, but further recovery may be limited.
- Contradictive technical signals mire Ethereum’s future.
- Ripple is badly hit by the SEC’s lawsuit; a move to $0.3 is a possibility now.
The cryptocurrency market has been in recovery mode recently. Bitcoin got back above $23,000 and ever re-tested $24,000 during early Asian hours on Wednesday. ETH also managed to recover and settle above the critical resistance zone of $600-610. Some smaller altcoins experienced double-digit gains, and some of them refreshed all-time highs. Synthetix outperformed the market with over 35% gains. XRP crashed following the news that SEC filed a lawsuit against Ripple and its top executives.
The total capitalization of all digital assets in circulation reached $646 billion, while an average daily trading volume came close to $200 billion. Bitcoin’s market dominance increased to 67.7%.
Bitcoin flirts with $24,000
Bitcoin recovered from the low of $21,910 reached on Monday, December 21, and touched the critical resistance of $24,000 during early Asian hours on Wednesday. However, the further upside may be limited at this stage as several technical indicators imply that another bearish wave is underway. Thus, an evening star candlestick pattern combined with the sell-signal from TD Sequential indicator on the 3-day chart. If the bearish scenario is confirmed, the price may retreat to $21,000 before another bullish wave starts.
BTC, 3-day chart
According to In/Out of the Money Around Price (IOMAP) data, the price sits on top of a strong support area. Over 840,000 addresses purchased 500,000 BTC from $23,100 to $23,600. If this area is cleared, the sell-off will gain traction with the next backstop below $21,000.
BTC, In/Out of the Money Around Price (IOMAP)
On the other hand, if BTC manages to stay above $23,000, the upside momentum will gain traction as there are no significant resistance areas on the way up.
ETH struggles to stay above critical support
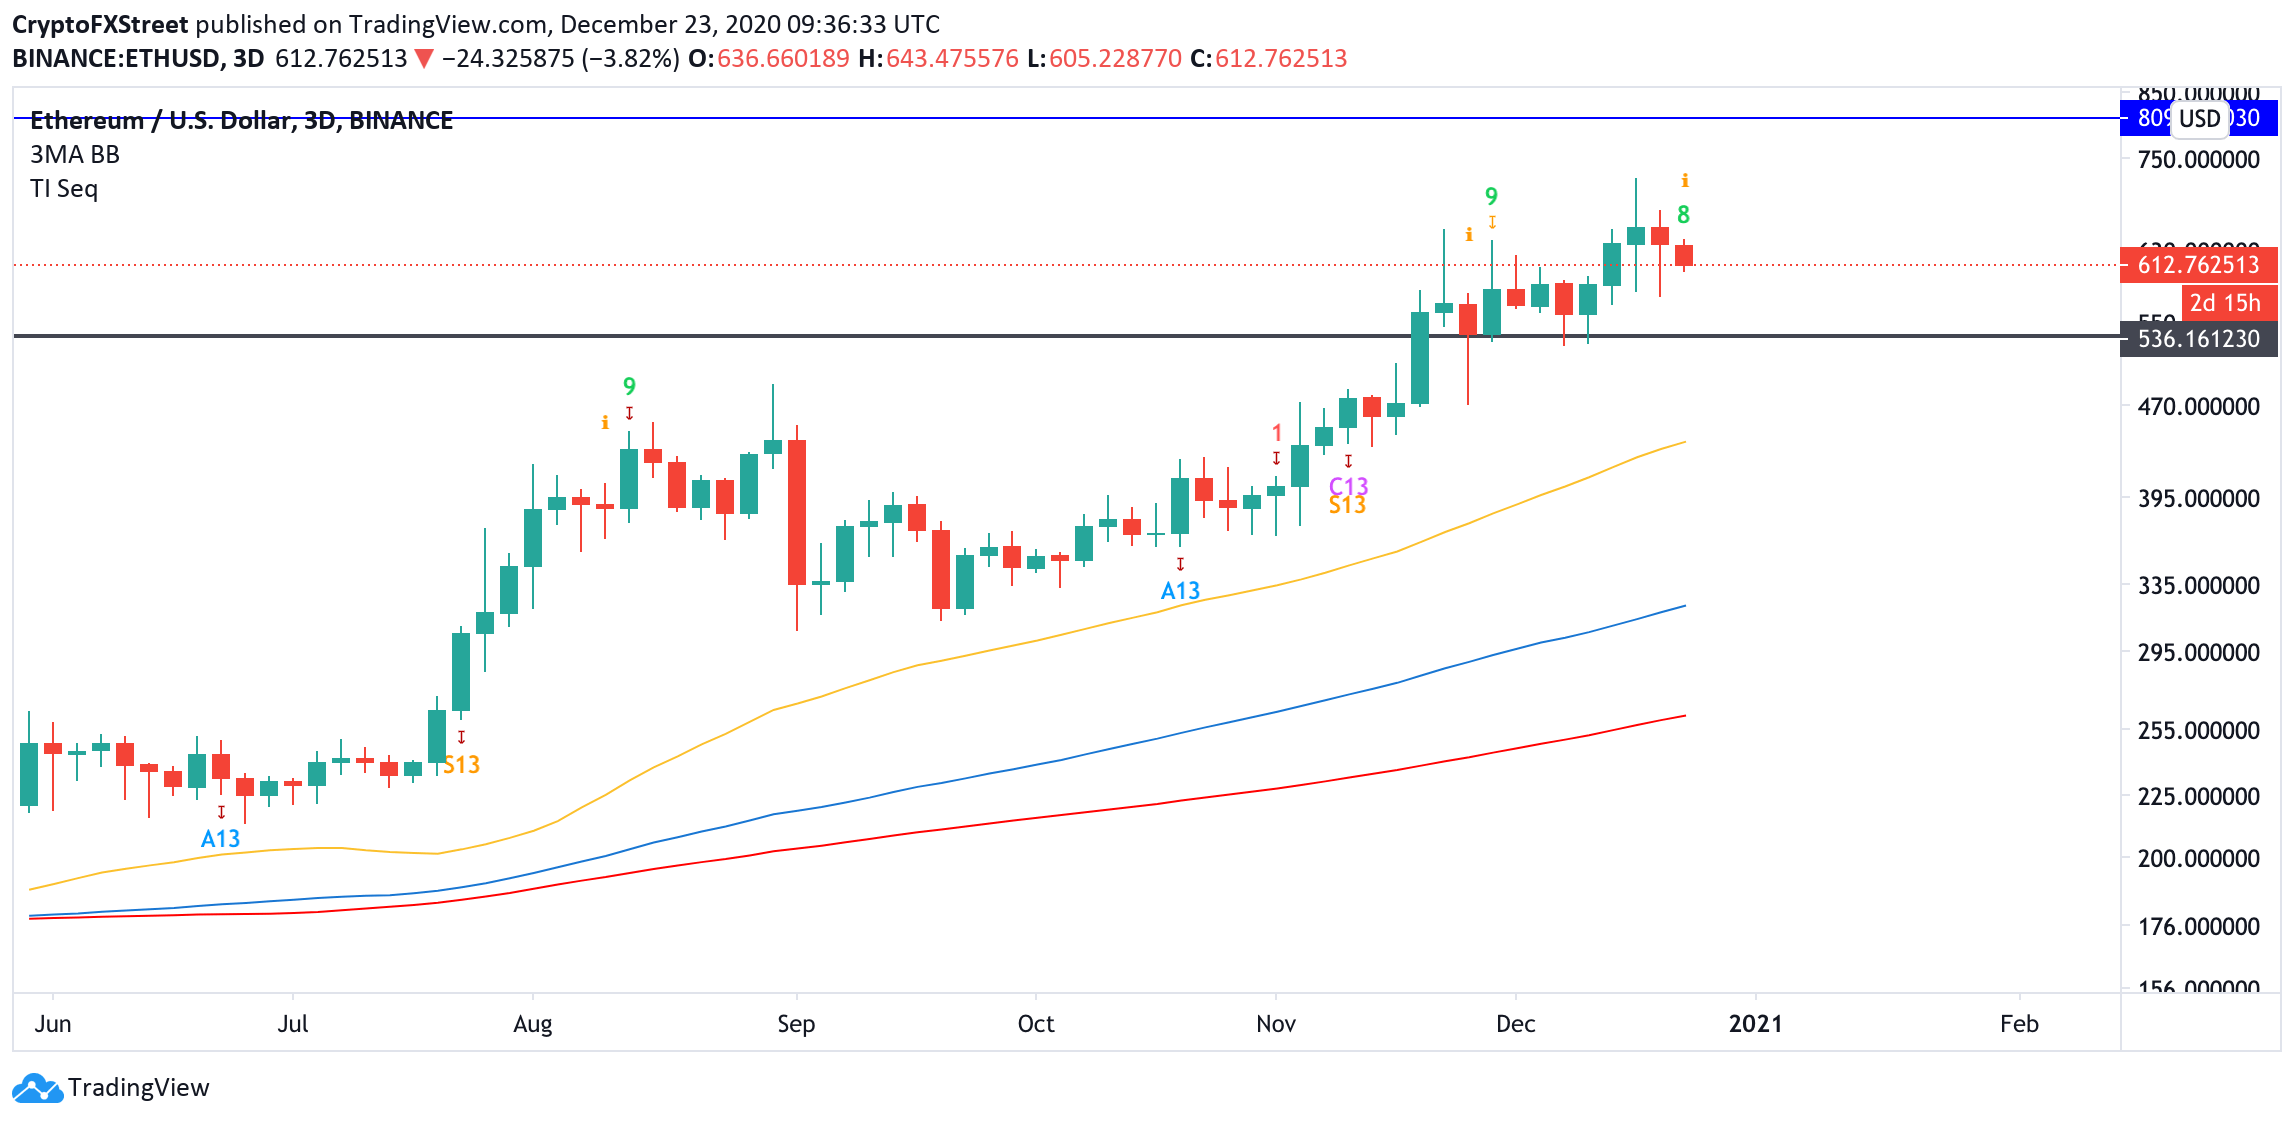
ETH is hovering at $610, mostly unchanged from this time on Tuesday. As previously discussed, a sustainable move above $620 is needed for the recovery to gain traction. However, the technical indicators imply that the downside correction is not over yet. TD Sequential indicator is ready to send a sell signal as the green nine candlestick is a harbinger of a potential reversal. If the bearish pattern is confirmed, the price will extend the decline towards $530 (the previous channel support coupled with the daily EMA50.
ETH, 3-day chart
On the other hand, a daily close above $620 will invalidate the immediate bearish outlook and bring new buyers to the market. In this case, ETH will re-test the recent high of $631 and proceed with the recovery towards $800.
Ripple is staring into the abyss
XRP extended the sell-off on Wednesday as the US Securities and Exchange Commission officially confirmed that it had filed the lawsuit against Ripple and its top managers. The regulator claims that the company sold unregistered securities to the public worth over $1.3 billion, with over $600 million of the raised funds found their way to Brad Garlington and Chris Larson’s private accounts.
The full tally of XRP sold by Ripple Labs to the public and institutions $1.388b
The SEC document claims $600m wound up in the private hands of Larson and Garlinghouse, the two CEOs that ran Ripple Labs through the course of the 8 years. pic.twitter.com/dAqKcyRNPs
— Willy Woo (@woonomic) December 23, 2020
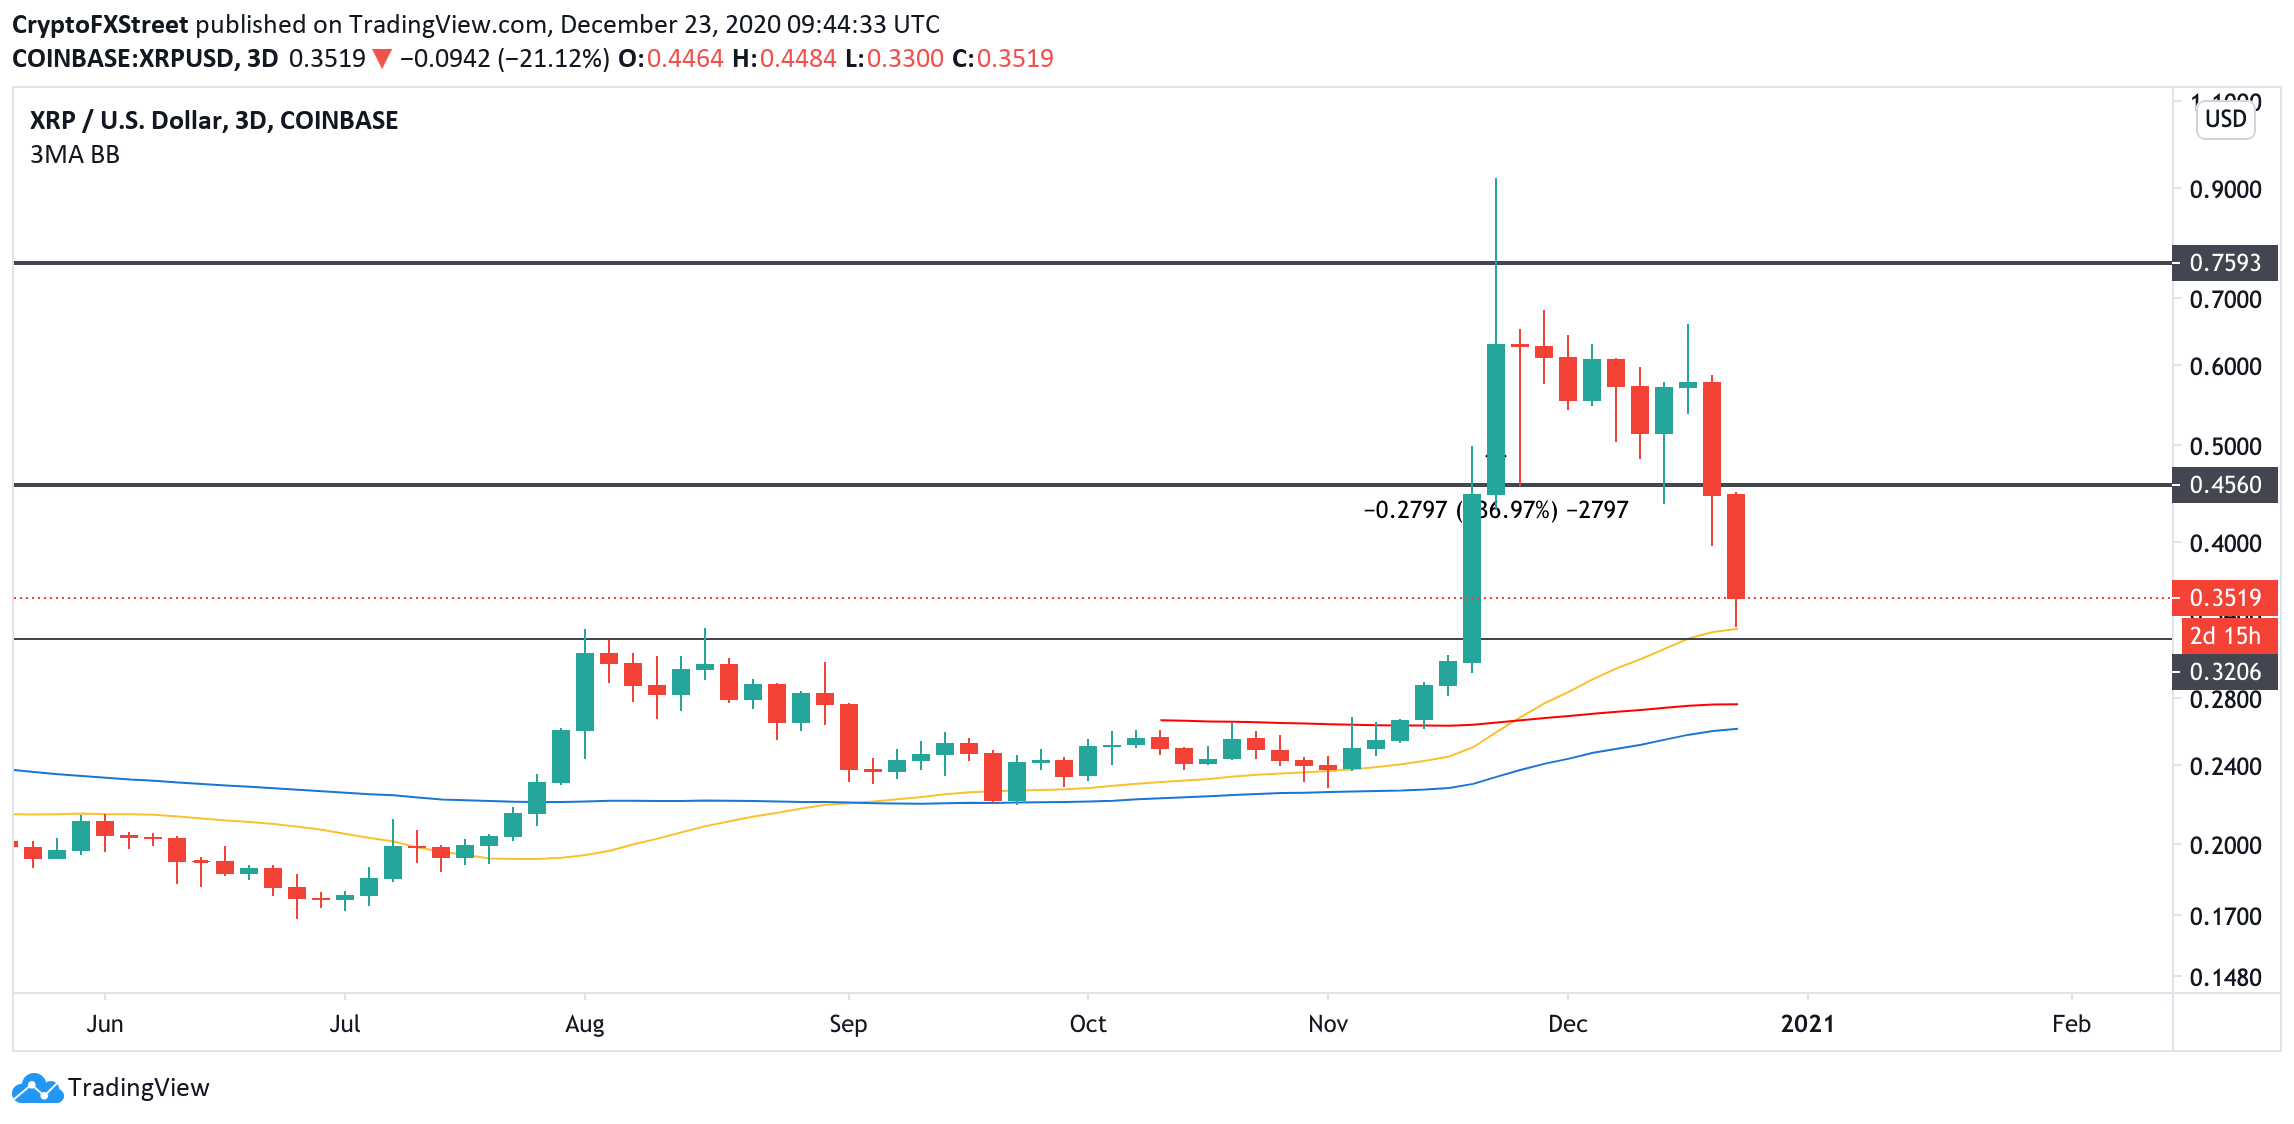
At the time of writing, XRP is changing hands at $0.34, down over 20% on a day-to-day basis. The coin came close to the vital support created by a combination of previous resistance, ana 3-day EMA50 on approach to $0.32. If this care gives way, the sell-off will start snowballing, taking XRP first to the psychological $0.3 and then, potentially to $0.26. This barrier is created by the weekly EMA50 that has served as a backstop for XRP since the end of July.
XRP, 3-day chart
On the upside, a move above $0.45 is needed to mitigate the bearish pressure and bring the recovery back on track with the next focus on psychological $0.5 and $0.61. This barrier is created by 78.6% Fibonacci retracement level.

%2023-637443141551984662.png)

