- Bitcoin jumped above $28,000 on the second stimulus package news.
- Ethereum faces a brick wall on the approach to $750.
- Ripple’s XRP is bleeding as cryptocurrency companies continue delisting the token.
The cryptocurrency market is on the rise again. Bitcoins recovered above $28,000 and set a new all-time high at $28,580 during early Asian hours. Since that time, the pioneer digital asset has retreated to $27,700, though it is still in a green zone both on a day-to-day basis and on a weekly basis. ETH settled above $730, while XRP is hovering around $0.20 after a massive sell-off to $0.17 on Tuesday, December 29. Other altcoins out of the top-50 are directionless.
The total capitalization of all digital assets in circulation increased by over $40 billion in less than 24 hours and settled at $751 billion. An average daily trading volume is close to $200 billion. Bitcoin’s market dominance recovered above 70%.
Bitcoin enjoys the stimulus rally
Bitcoin jumped to a new all-time high only to retreat to $27,700 by press time. Despite the downside correction, the coin is still over 5% higher on a day-to-day basis. As FXStreet previously reported, US President Donald Trump signed the second stimulus bill worth $900 billion. The announcement triggered a massive rally across all asset classes. The cryptocurrency experts believe that the Americans may want to invest their stimulus checks in Bitcoin, just as they did with the first stimulus checks. In this case, the market will see an increase in new retail users.
From the technical point of view, BTC may continue the retreat towards the former resistance of $27,000-$26,700. If it is verified as a support, the upside momentum will gain traction, pushing the price back above $28,000 and new all-time highs. On the 1-hour chart, this area is reinforced by EMA50 and EMA100, meaning that the bears might have a hard time pushing through.
BTC, 1-hour chart
In/Out of the Money Around Price (IOMAP) data confirms that the price sits on top of a strong support area. Over 220,000 addresses purchased 190,000 BTC from $27,000 to $26,700. It is followed by an even bigger cluster of addresses with a breakeven point around $26,600. This area has the potential to absorb the bearish pressure.
BTC, In/Out of the Money Around Price (IOMAP)
On the upside, once $28,000 is out of the way, BTC will re-test the all-time high of $28,580 and aim at the next psychological barrier of $29,000. A sustainable move above this area will take BTC on uncharted territory with the next major target at $30,000.
ETH failed at $750 again
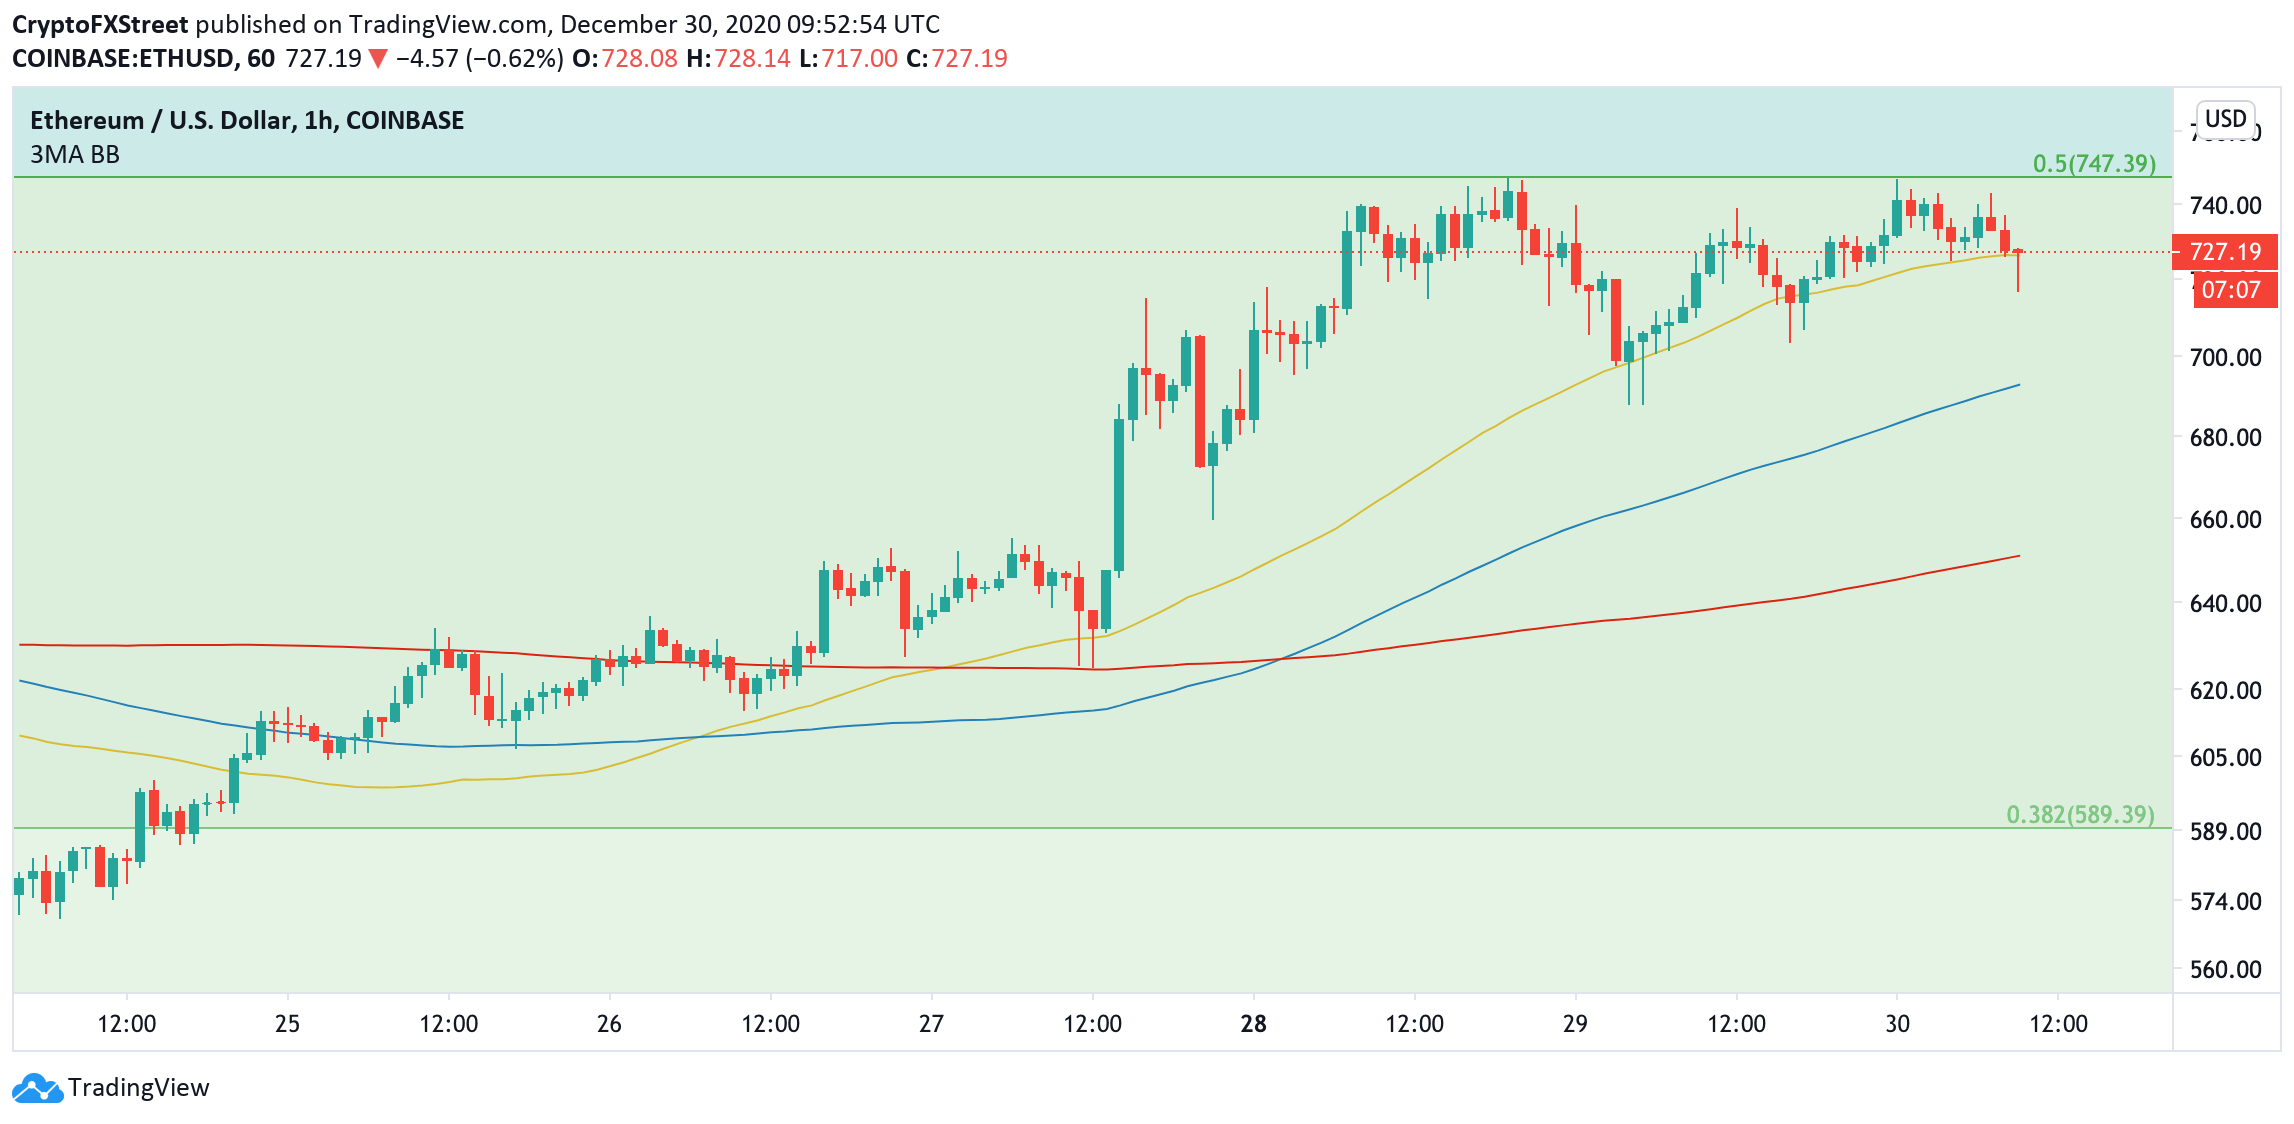
ETH bulls made another attempt to break above a critical resistance area of $747 created by 0.5 Fibo retracement level for the downside move from January 201 high to December 2018 low. As the upside momentum faded away on approach to a significant barrier, ETH dropped to the intraday low of $717 before recovering to $725.
On the intraday charts, ETH is sitting at the 1-hour EMA50, currently $725. The short-term trend remains bullish as long as the price stays above this area. A sustainable move below this level will trigger the sell-off towards $700 and $688 (December 29 low). This support is strengthened by 1-hour EMA100.
ETH, 1-hour chart
On the upside, $750 is the crucial target for ETH bulls. Once this resistance is out of the way, the upside momentum will start snowballing, taking the price to $800.
Ripple attempts a recovery amid gloomy fundamentals
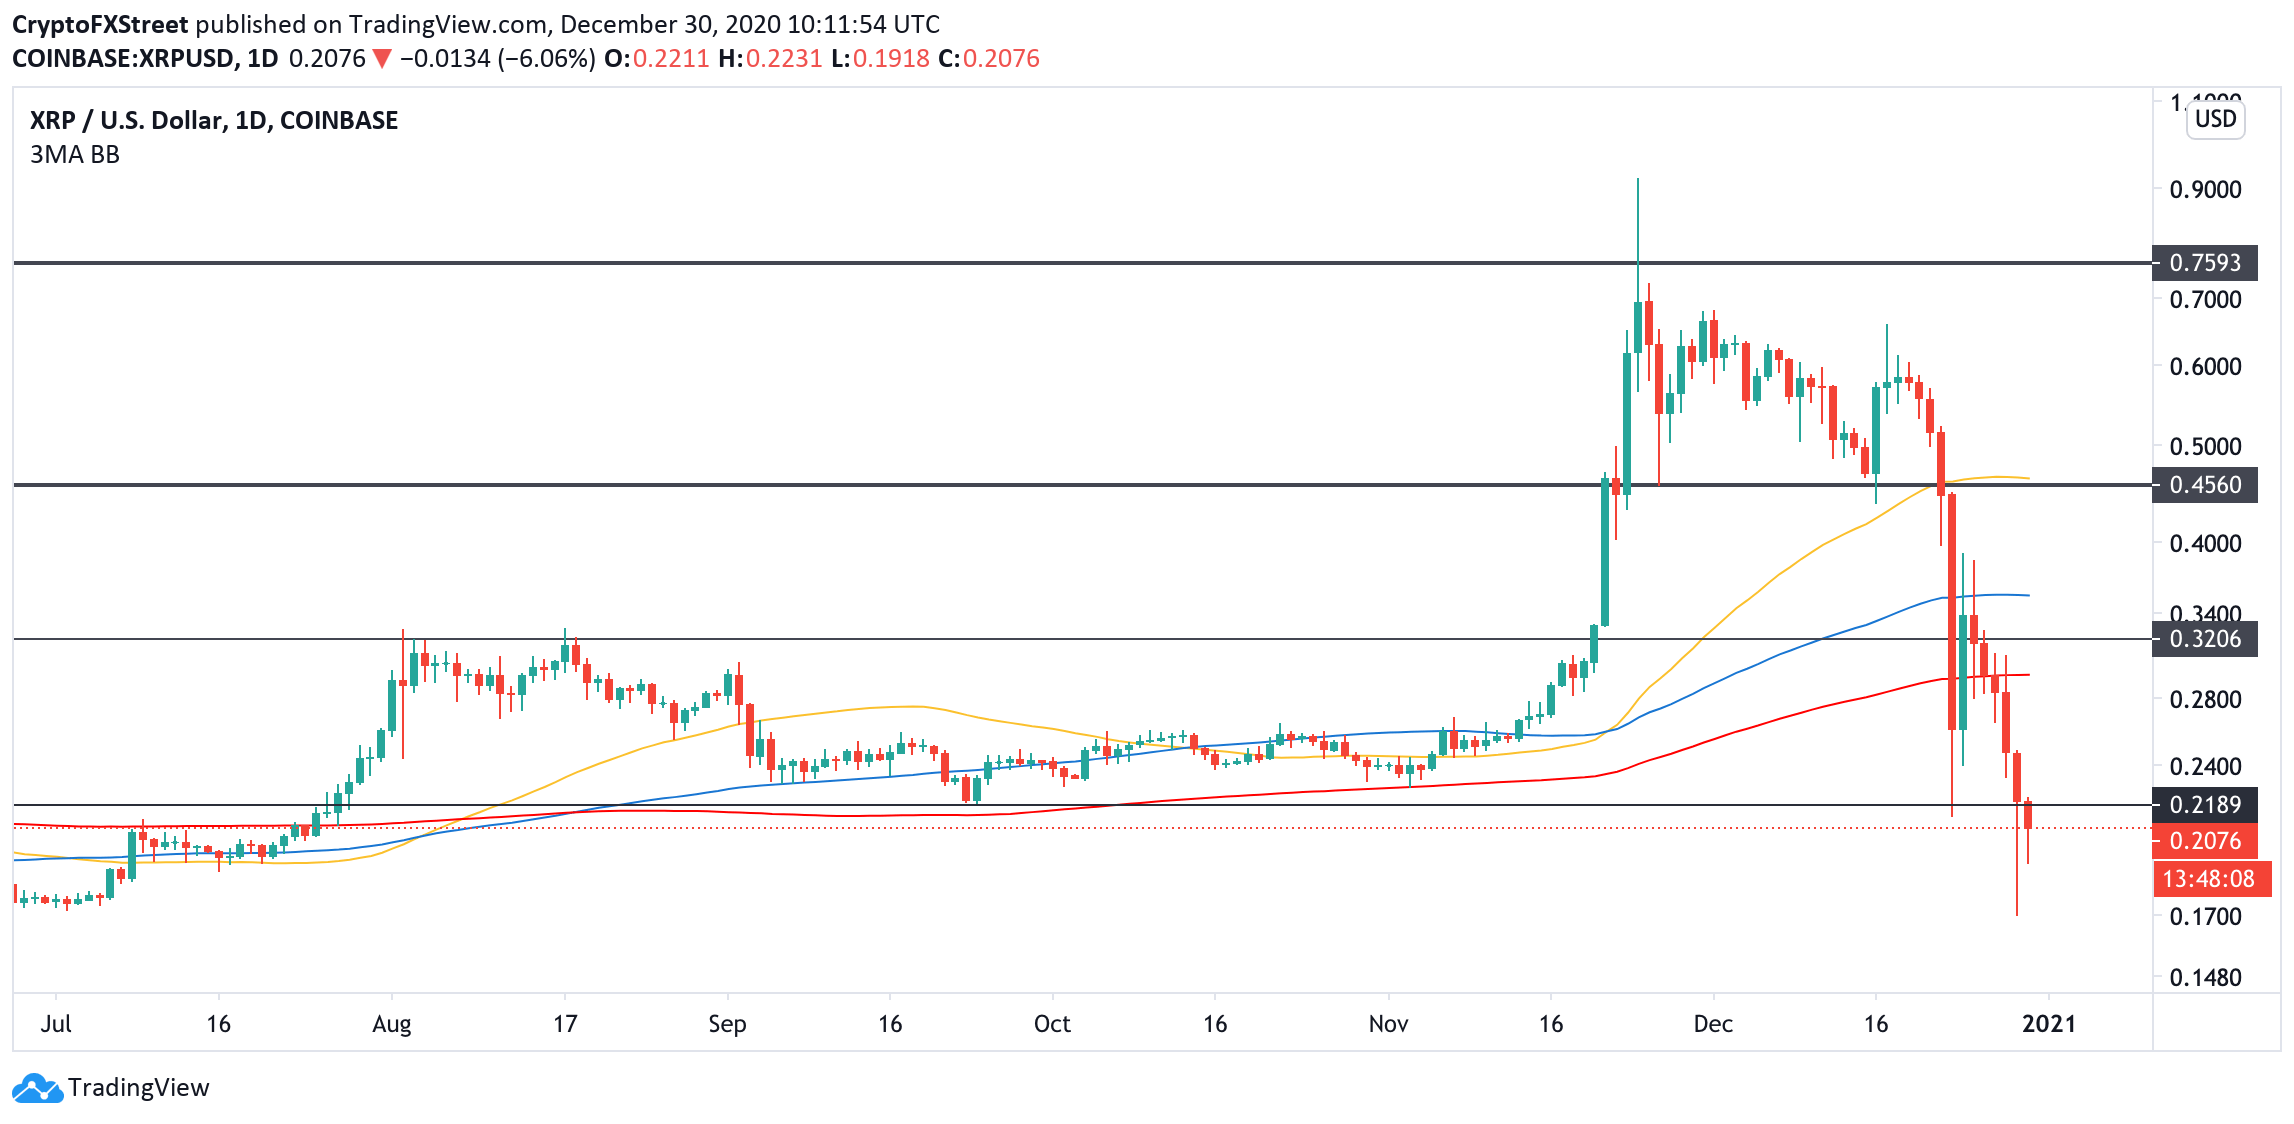
XRP crashed to $0.17 on Tuesday, December 29, before some positioning inspires the correction above $0.20. At the time of writing, the token is changing hands at $0.21, down nearly 7% on a day-to-day basis and 42% on a weekly basis. Despite the recovery, the short-term trend is still deeply bearish, meaning that the price may resume the decline.
The cryptocurrency companies continue delisting XRP or suspending XRP trading. The cryptocurrency debit and credit card provider Wirex announced that it would exclude XRP from the US launch. Bitcoin Swiss also temporarily suspended XRP trading, according to the email received by the company’s customers.
From the technical point of view, the price broke below $0.22, the former channel support that limited XRP’s decline since the end of July. If the price fails to recover above this area, XRP will extend the descent to the psychological $0.2 and $0.175.
XRP, daily chart
On the upside, the token needs to recover above weekly EMA50 at $0.25 to mitigate the immediate bearish pressure and allow for a further recovery towards daily EMA200 at $0.295 and the channel resistance of $0.32.
The critical bullish target is seen at $0.45. However, it is out of reach at least until Ripple settles its legal dispute with SEC.

%2030-637449200773581534.png)

