Bitcoin (BTC/USD) and Ripple (XRP/USD) Price, Analysis and Chart:
The latest cryptocurrency rally is on pause at the moment with a wide range of coins and tokens consolidating their recent heavy gains. Bitcoin continues to lead the way forward and yesterday touched a new all-time high of just under $20,000 and now looks set to move even higher in the coming days. Other tokens and coins have rallied hard recently but remain far away from their December 2017 spike peaks. BTC’s dominance of the market remains at just over 62% with the market as a whole capitalized around $580 billion.

Recommended by Nick Cawley
Get Your Free Introduction To Bitcoin Trading
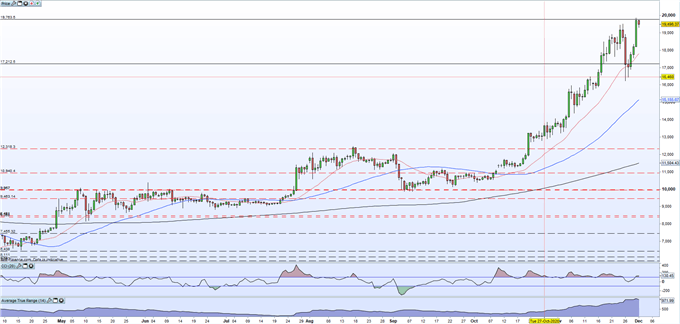
Bitcoin continues to gain support from a positive moving average set-up with all three simple dmas pointing higher and in sequence. Last Thursday’s sell-off has been bought back, producing a short-term series of higher lows and higher highs, while the CCI indicator is only just in overbought territory. Short-term support around $18,200-$18,400.
To learn more about moving averages, check out DailyFX Education
Bitcoin (BTC/USD) Daily Price Chart (April – December 1, 2020)


Recommended by Nick Cawley
Improve your trading with IG Client Sentiment Data
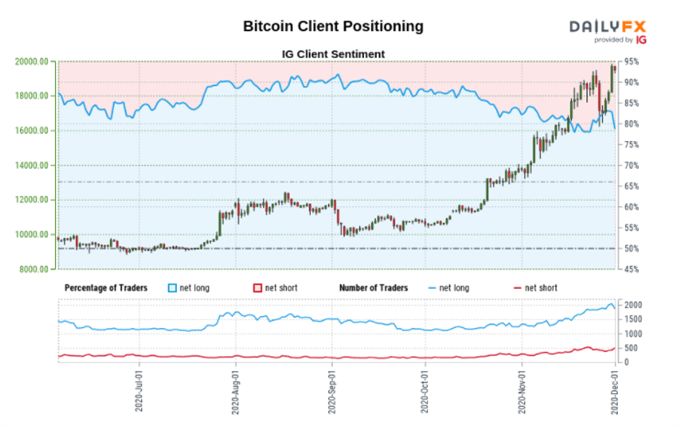
The latest IG retail positioning data show that traders have been increasing their short positions into the recent rally. Retail trader data shows 78.18% of traders are net-long with the ratio of traders long to short at 3.58 to 1. The number of traders net-long is 5.54% lower than yesterday and 2.37% higher from last week, while the number of traders net-short is 21.26% higher than yesterday and 23.87% higher from last week.
We typically take a contrarian view to crowd sentiment, and the fact traders are net-long suggests Bitcoin prices may continue to fall.Yet traders are less net-long than yesterday and compared with last week. Recent changes in sentiment warn that the current Bitcoin price trend may soon reverse higher despite the fact traders remain net-long.
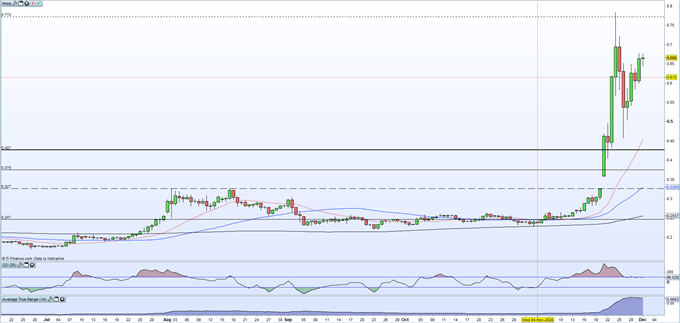
Ripple (XRP/USD) still has a long way to go before it troubles the highs seen in December 2017 when it spiked in excess of $3.05, or even higher depending on which exchange is used. What is very noticeable on the Ripple daily chart is the sharp move higher in volatility using the ATR reading at the bottom of the chart. Ripple currently trades around 66 cents while the daily vol reading is nearly 7 cents, the highest level since the beginning of December 2017 and the start of the sharp spike higher. Again, all three moving averages are supportive and a re-test of last Thursday’s high of $0.78 may be likely.
Ripple (XRP/USD) Daily Price Chart (June – December 1, 2020)
Traders of all levels and abilities will find something to help them make more informed decisions in the new and improved DailyFX Trading Education Centre
What is your view on Bitcoin and Ripple – bullish or bearish?? You can let us know via the form at the end of this piece or you can contact the author via Twitter @nickcawley1.


