- Litecoin is able to perform positive from the past couple of days after touching the critical support level of $65.00 on the downside
- The price levels are looking for a positive, sustainable breakout above the crucial mark of $80
- The LTC/BTC pair has also turned positive with an overall gain of 2.85% bringing the current level to 0.00427093 BTC
The weekly price performance chart of Litecoin highlights the testing of significant resistance placed at $90.00 which went negatively as the price levels faced strong negative reversals and arrived at the critical support level of $65.00 on the downside. The support level did help the coin to revive its positive momentum, and in the current market session, it is looking for a positive breakout above $80.00. The CMP is placed at $79.21 with an overall gain of 7.33% resulting in the market capitalization incline by 0.06% and the 24-hour volume traded to decline by -0.26.
Technical Levels Supporting LTC Bulls For Breakout Above $80

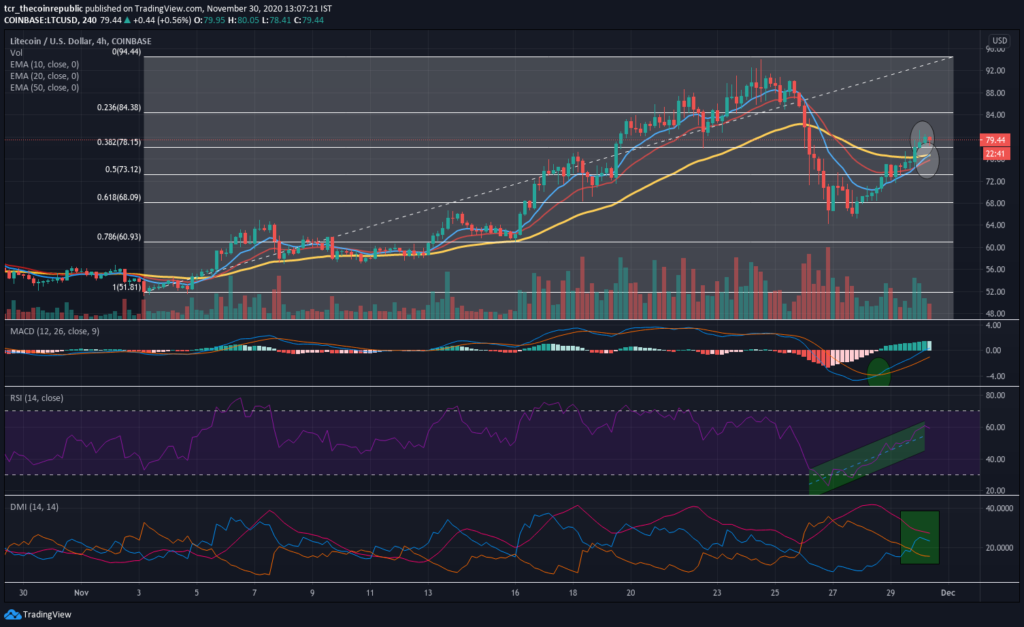
The technical chart of Litecoin highlights the attempt made by the price levels to test the major resistance placed at $90.00 which went unfavourable for the coin as it faced massive negative reversals in later trading sessions and dropped to the critical lower level around $65.00. The price mark acted as the support and helped the digital asset to revive its positive momentum which sustained in the current market session also resulting in a potential scenario for a positive breakout above $80.00
The price candles have already given a positive breakout above the 0.382fib level and are looking to build sustainability above the region.
On the moving averages, EMA-10 has already given a sustainable positive crossover against EMA-20 and looking for a break above EMA-50, which is a strong positive signal for the price levels. However, if the bears made a comeback while the price levels made another resting for $90.00 in upcoming trading sessions, EMA-50 can be acting as a support line.
The moving average convergence & divergence (MACD) after giving a bullish crossover provide significant positive momentum to the price levels and currently showing no signs of retracement.
The relative strength index (RSI) is also moving positively after touching the oversold region and strongly targeting the overbought territory with the current level of 55.44.
The directional movement index (DMI) also showcases the bullish nature as ADX (26.60) moves well above +DI(22.67) and -DI(16.40).
Can Litecoin Make Another Retest of Resistance at $90?
The current positive move has not only advanced Litecoin’s price levels but created rejoice in the majority of the altcoins. If the overall market sentiments continued to stay positive, we might expect LTC to make another attempt for retesting the mentioned resistance point. As of now, a positive breakout above $80.00 is looking at a possible scenario for the digital asset.
Resistance Level: $90.00
Support Level: $65.00 & $60.00
