- XRP price has hit the critical resistance barrier at $0.26 again and got rejected.
- The price is now bounded between the 50-SMA and the 100-SMA on the daily chart.
XRP has established a critical resistance level at 0.26, tested on eight different occasions from September 4 until November 7. The last try managed to push XRP’s price towards $0.267 before quickly dropping to $0.244 on the same day.
XRP bulls have to crack $0.26 to target $0.30
The critical resistance barrier at $0.26 now coincides with the 100-SMA on the daily chart, adding even more strength to the level. The current price of XRP at $0.25 has bounced from the daily 50-SMA at $0.245.
XRP/USD daily chart
The price is contained between the 50-SMA and the 100-SMA. A breakout above $0.26 would be significant; however, the digital asset needs to also close above this point to target $0.30 as an initial price point.
Bears, on the other hand, are looking at the 50-SMA as the closest support level. The rejection on November 7 from the crucial resistance level at $0.26 is a clear and robust bearish sign considering all the previous rejections.
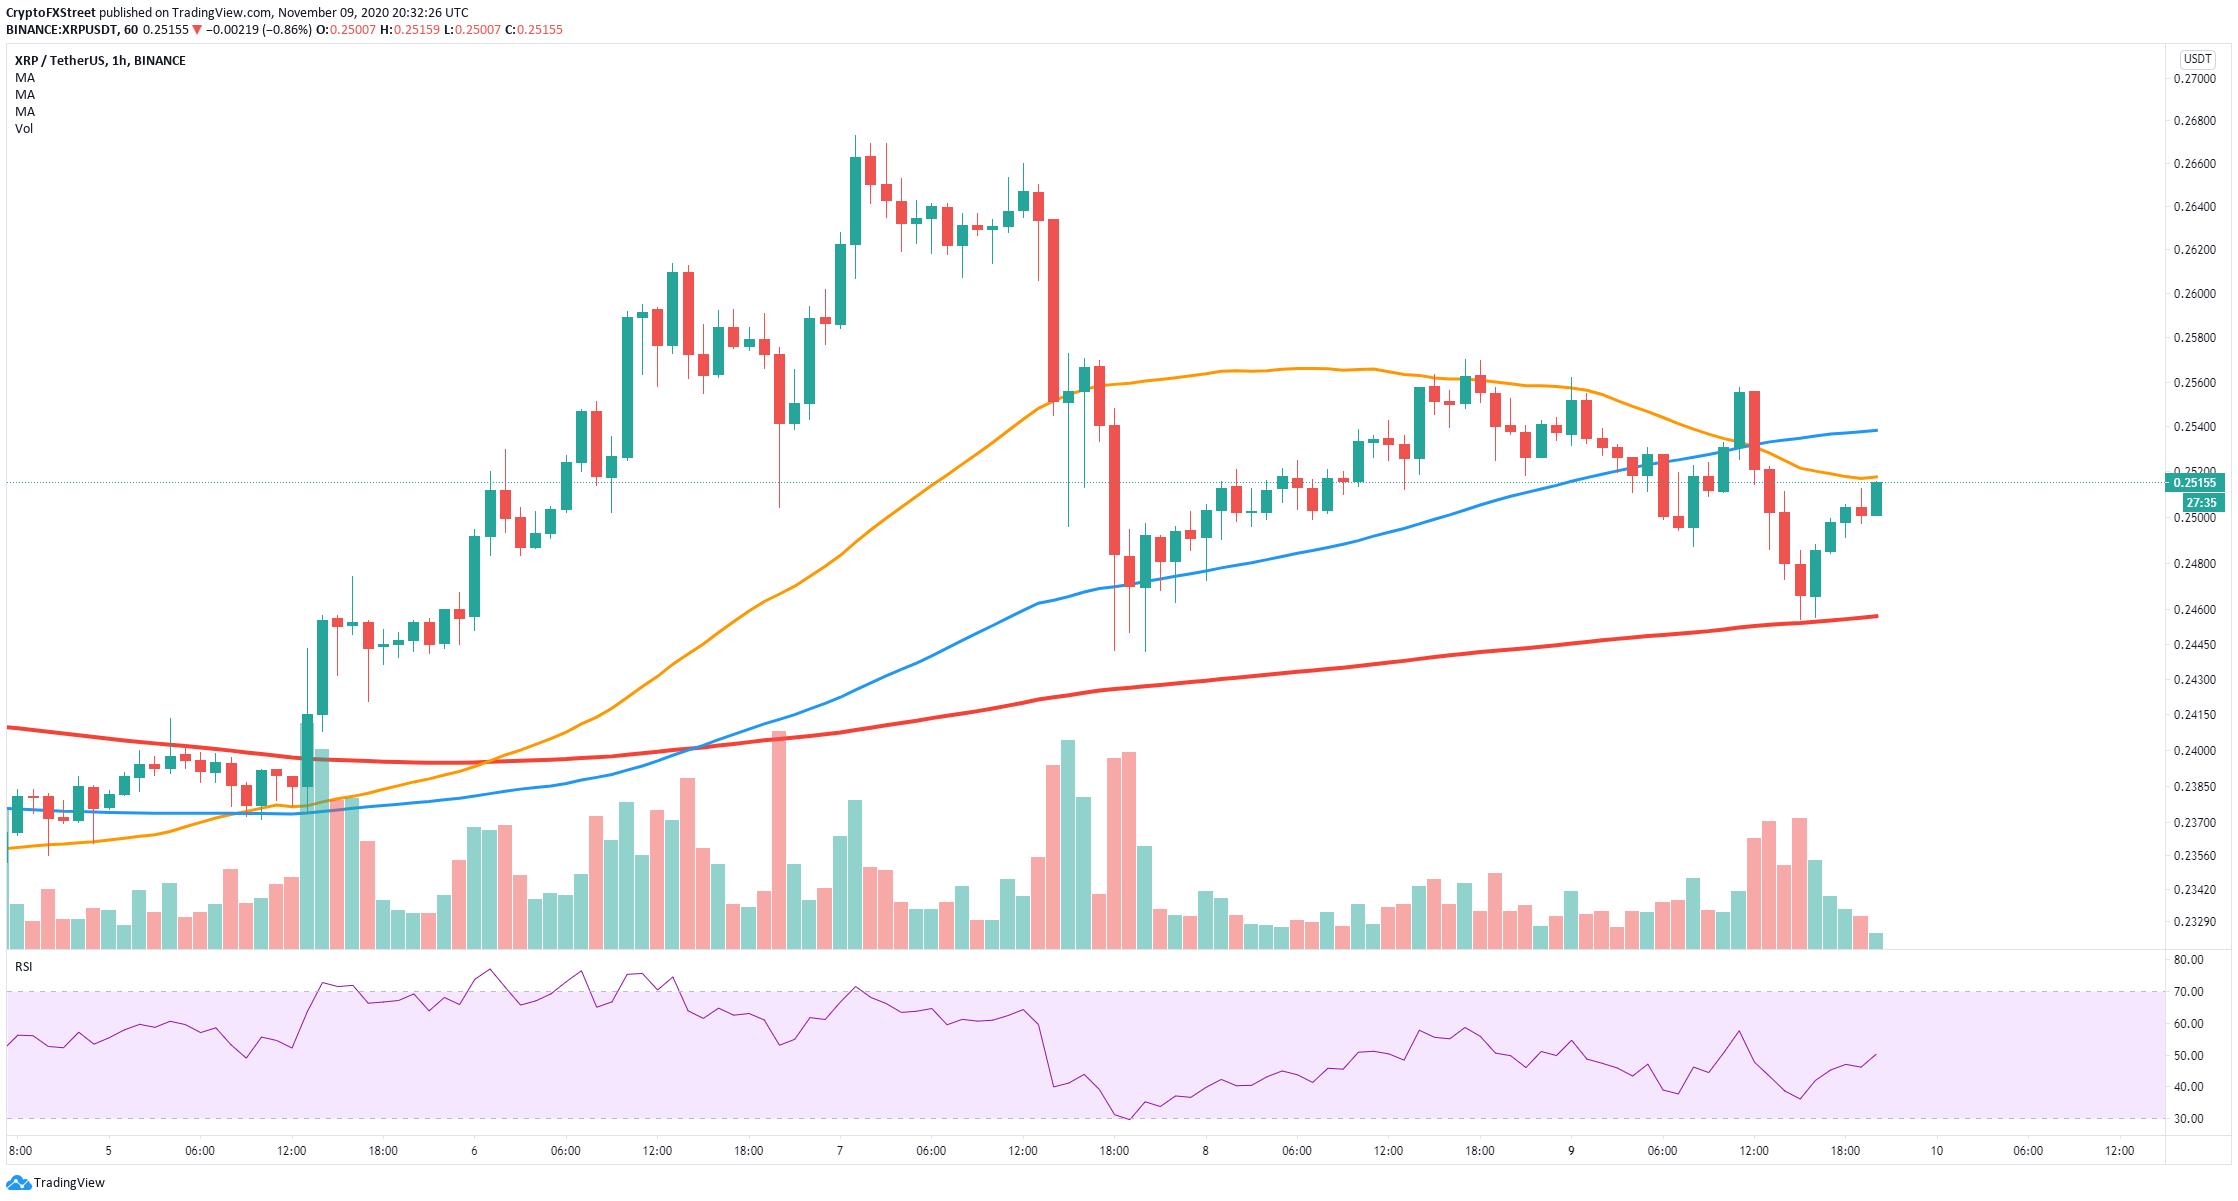
XRP/USD 1-hour chart
On the hourly chart, XRP’s price faces a strong resistance level at $0.252, the 50-SMA. The digital asset has established a downtrend, and it’s eying up a breakdown below the 200-SMA at $0.245, which would push XRP’s price towards $0.237.

