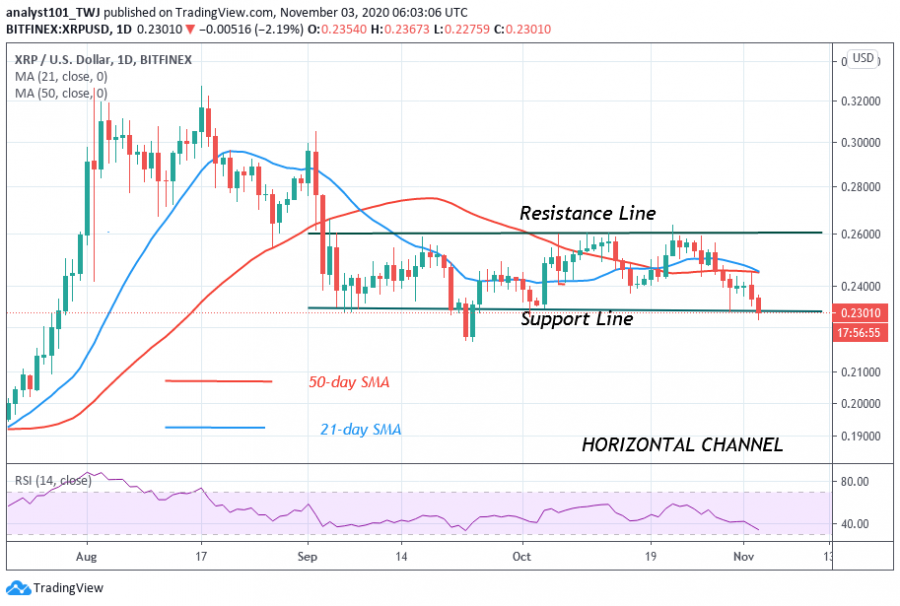
Yesterday, the selling pressure of Ripple persisted as bears pushed price to a low of $0.22800. Before this time, the crypto has been range-bound between $0.23 and $0.26 since September 3.
Buyers have made more than three unsuccessful attempts to break the $0.26 resistance. The bearish reaction has enabled sellers to break the current support at $0.23.
There are indications that the current price fall may extend to a $0.22 low. Presently, the price is making an upward correction on the upside. In the same vein, if buyers can defend the current support and push the price upward, the range-bound movement will resume. However, if the selling pressure persists, the coin will fall and reach the oversold region of the market. By implication, buyers will emerge in the oversold region to push prices upward.
Ripple indicator analysis
The price has broken the support line of the horizontal channel. If price breaks and closes below the support line, the downtrend will resume. The price bars are below the SMAs which also suggest a further downward movement of prices.

Key Resistance Zones: $0.35, $0.40, $0.45
Key Support Zones: $0.25, $0.20, $0.15
What is the next move for Ripple?
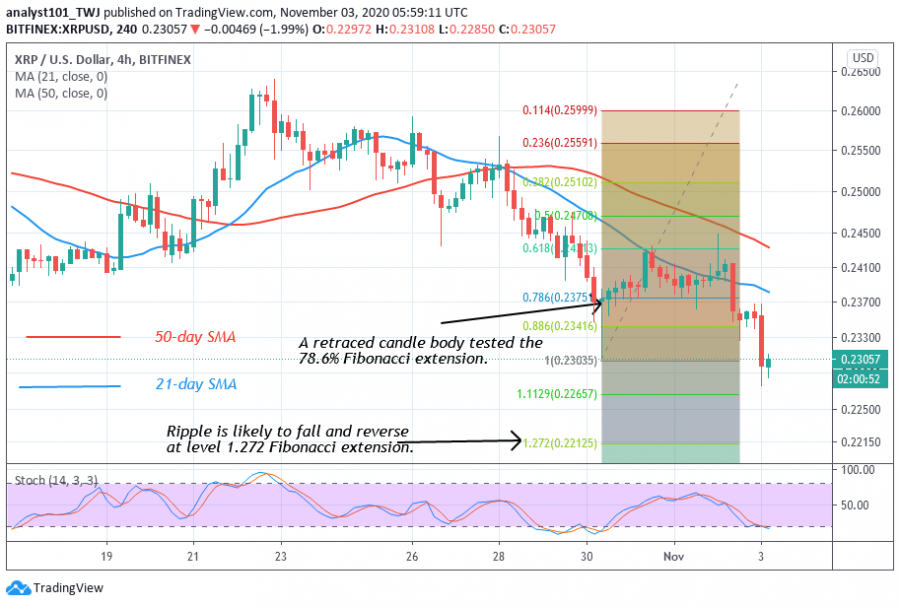
From the price action, Ripple made an upward move and rested the $0.24 high on October 31. A similar retest was made on November 2, which resulted in a further downward movement of the coin. Meanwhile, On October 30 downtrend; the retraced candle body tested the 78.6% Fibonacci retracement level. This implies that XRP will decline to level 1.272 Fibonacci extensions or $0.22125 low.

Disclaimer. This analysis and forecast are the personal opinions of the author that are not a recommendation to buy or sell cryptocurrency and should not be viewed as an endorsement by CoinIdol. Readers should do their own research before investing funds.
