- Ethereum price is bounded inside an ascending parallel channel.
- The upper boundary of the pattern is a crucial resistance level.
- Bulls are aiming to hit $520 if they can crack the upper trendline at $485.
Ethereum is currently trading at $461, bounded inside an ascending parallel channel on the hourly chart. The digital asset looks poised to test the upper trendline at $485. A breakout above this point can quickly drive Ethereum price towards $520.
Ethereum bulls eying up $520
The current hourly ascending parallel channel is the most significant pattern in the short-term. The upper trendline at $485 has acted as a healthy resistance level since November 7. Ethereum price is currently in the middle of the pattern and above the 100-SMA.
ETH/USD 1-hour chart
Ethereum looks poised to climb towards $485 after conquering the 100-SMA as a support level for the first time since November 14. A breakout above the upper trendline would be significant and likely to drive ETH towards $520, using the pattern’s height.
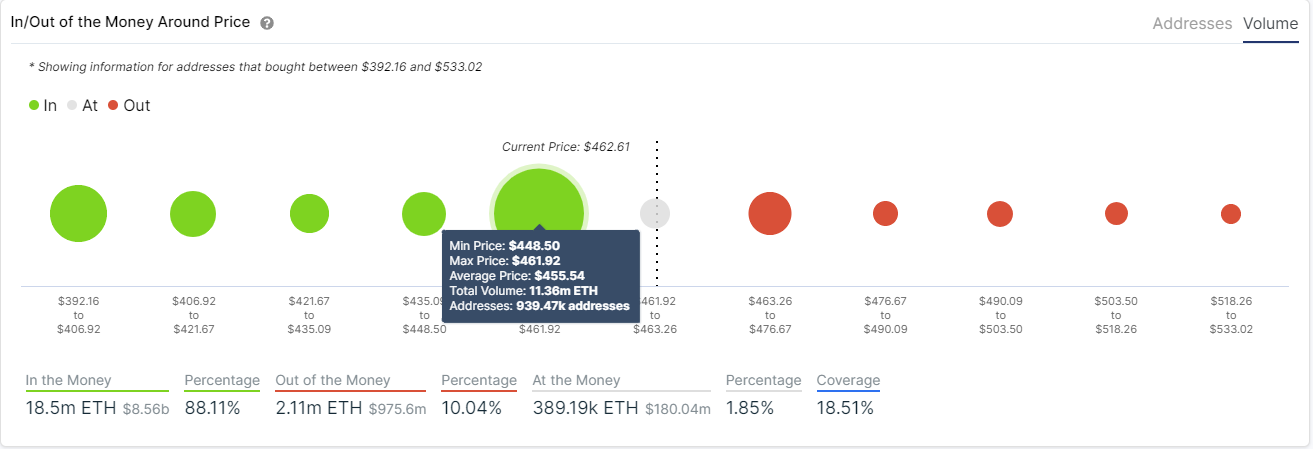
ETH IOMAP chart
The In/Out of the Money Around Price chart certainly seems to favor the bulls, showing a robust support area between $488 and $461 but almost no resistance ahead, well until $533. This adds strength to the bullish outlook.
The bulls’ most prominent issue in the short-term is not getting stopped by the middle trendline of the parallel channel. A loss of the 100-SMA would also be notable and could push Ethereum price towards the lower boundary of the pattern at $443.

