For the most part of November, the crypto market was filled with strong bullish momentum as Bitcoin inched closer to its ATH, last seen in 2017. However, with BTC unable to sustain its position above the $19K price level and with its current drop on the charts, many of the market’s altcoins are now enduring their own price corrections.
Ethereum [ETH]
Source: ETH/USD, TradingView
Ethereum’s price witnessed a $12.5 percent price dip in the past 24-hours and is currently trading at $503.2. According to CoinMarketCap, ETH has a market cap of $57 billion with a 24-hour trading volume of $24 billion. At press time, ETH is testing the support at $504 and if the coin endures a further dip, it can count on the next support at $480. However, if an uptrend were to start there is considerable resistance at the $532 price level.
The Bollinger Bands have contracted significantly and indicate low volatility for ETH’s price. The RSI indicator on the other hand is now moving slowly away from the oversold zone and into the neutral zone.
Cosmos [ATOM]

Source: ATOM/USD, TradingView
Since the early hours of 26 Nov, the price of Cosmos has fallen by close to 12 percent. At press time Cosmos is being traded at $5.19 with a market cap of over $1 billion. The current trading price of the coin is now testing the support at $5.14 with strong resistance around $5.4.
The EMA ribbons have now settled above the coin’s current trading price and are likely to offer resistance when an uptrend occurs. The RSI indicator continues to remain close to the oversold zone but is now moving towards the neutral zone.
Basic Attention Token [BAT]

Source: BAT/USD, TradingView
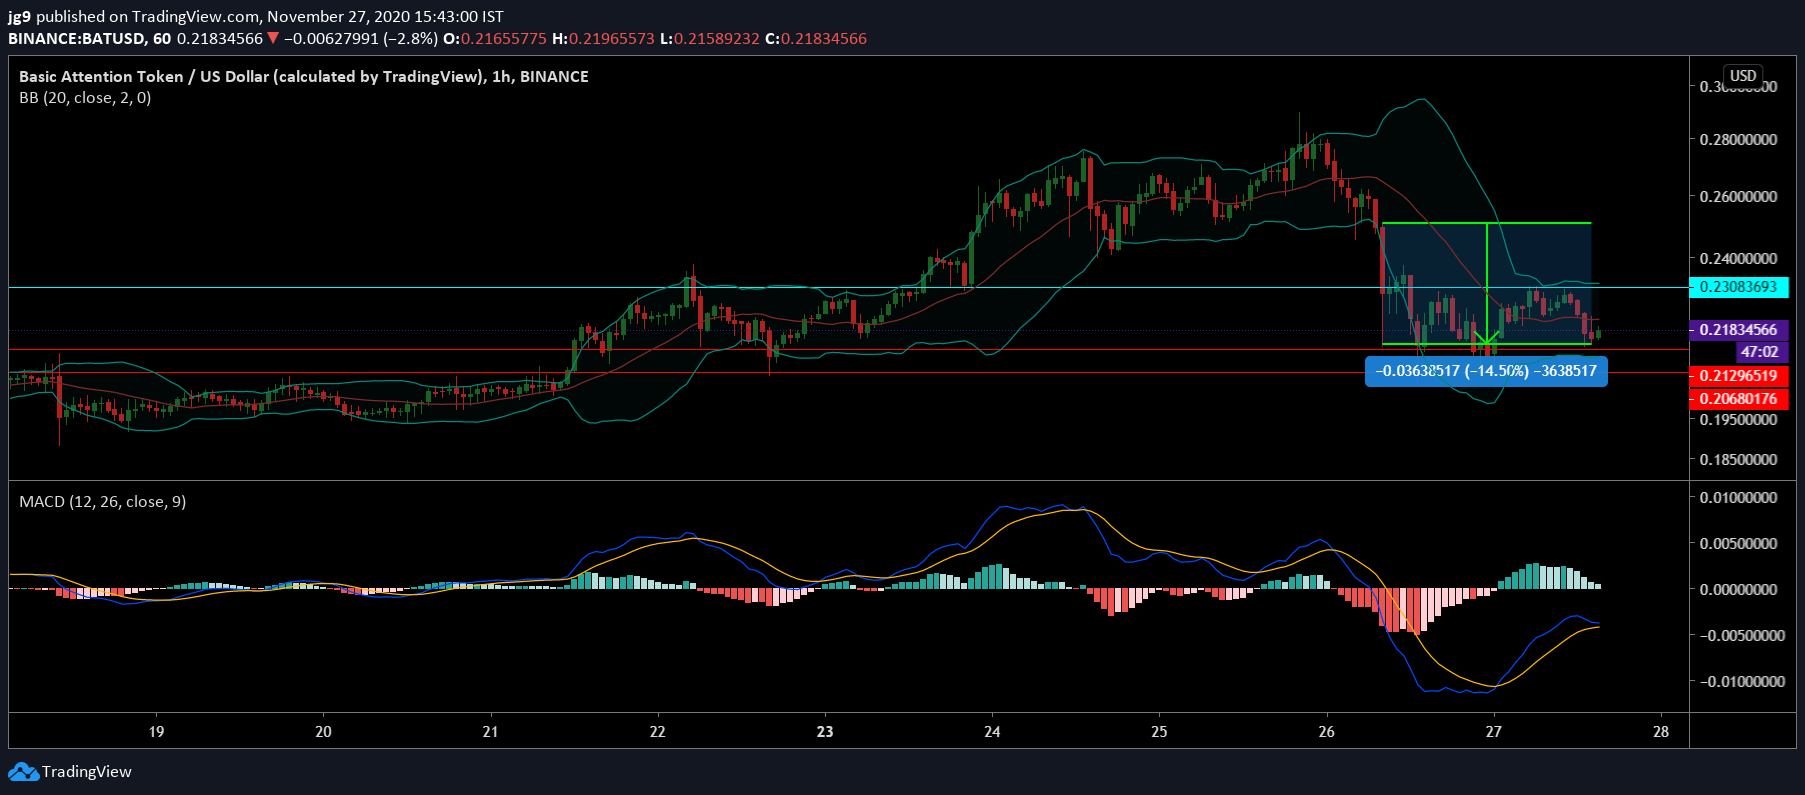
Akin to the price action of most altcoins in the past few days, BAT saw a price drop of close to 15 percent since the dawn of 26 Nov. At press time the coin is valued at $0.217 and a 24-hour trading volume of $213 million. BAT has two strong points of support close by at $0.212 and $0.206. However, there is also resistance at $0.230 if the price correction leads to an uptrend for BAT.
After having a period of high volatility, the Bollinger Bands have now contracted. The MACD indicator however seems to be on the verge of a bearish crossover with the signal line coming very close to going past the MACD line.
