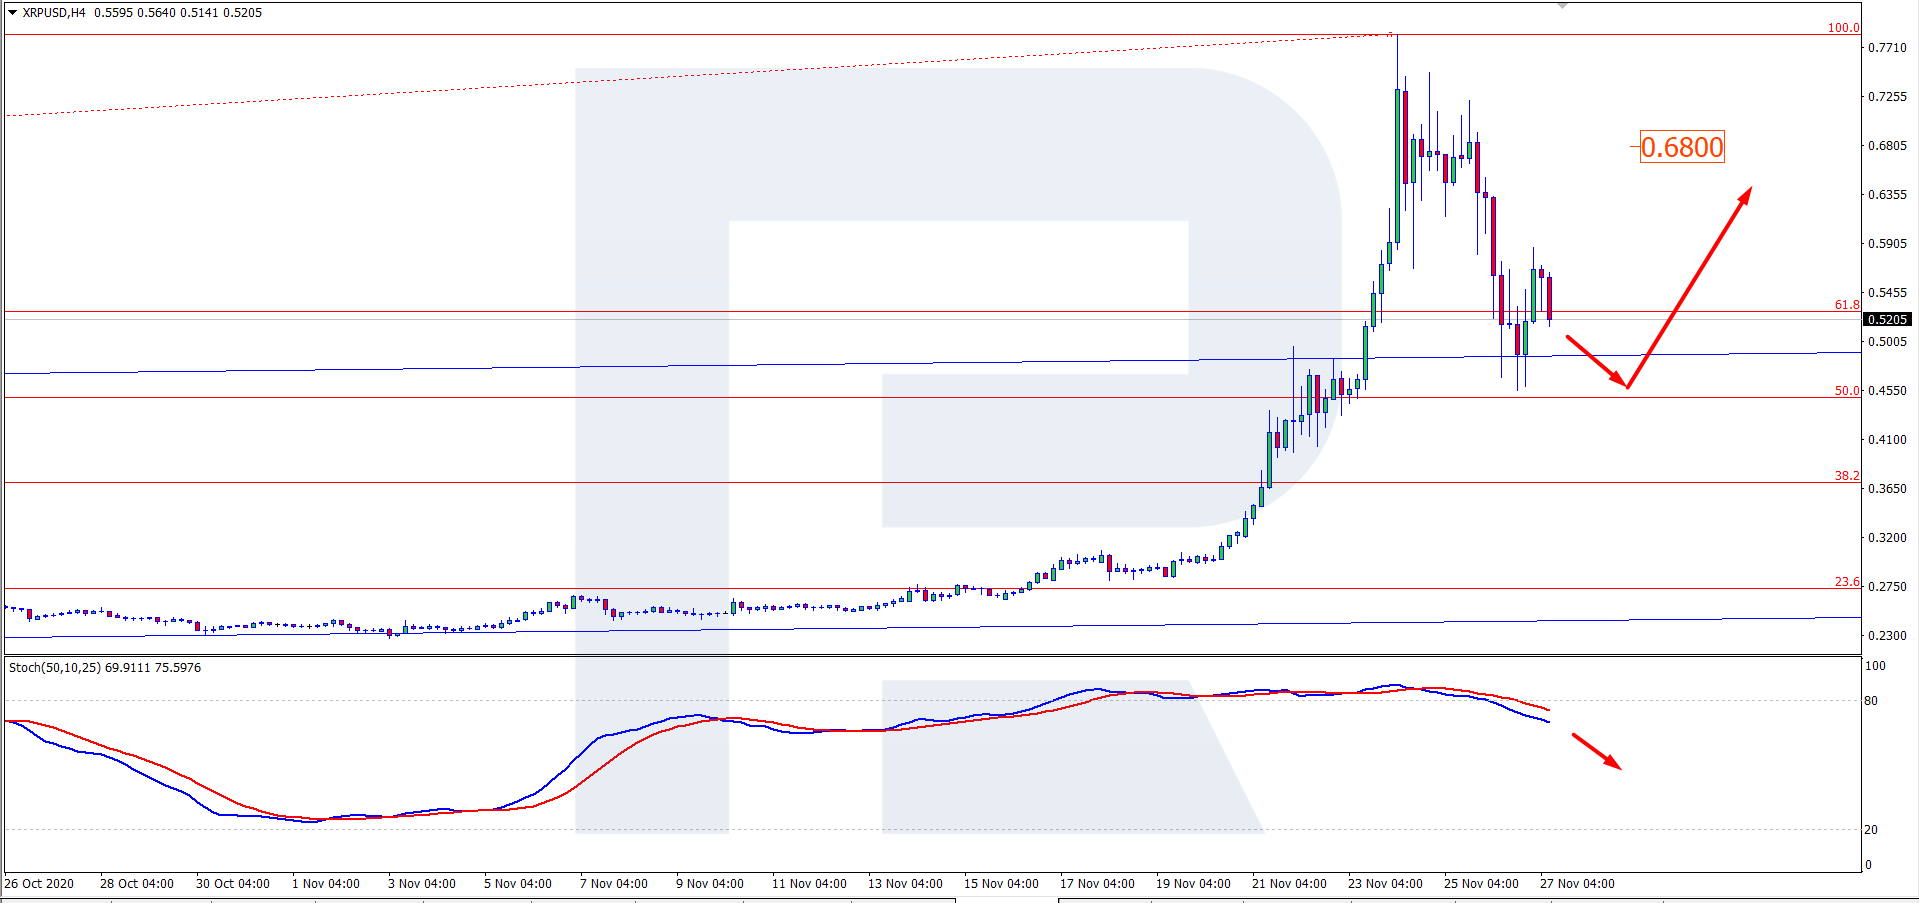
On Friday, November 27th, XRP has reached stability but is still correcting and trading at $0.5550.
As we can see in the daily chart, after finishing a quick rising wave, XRP/USD price is correcting to the downside. At the moment, the asset is trading close to 61.8% fibo, a breakout of which will indicate further pullback towards 50.0% fibo. The MACD histogram has broken 0 and is still moving to the upside – it may be another signal in favor of a new rising impulse. The upside target of the completion of the correction will be at 0.6800.
In the H4 chart, the cryptocurrency continues correcting to the downside. Right now, it is testing the support level, a breakout of which will result in further decline towards 50.0% fibo. The Stochastic indicator has formed a “Black cross” inside the “overbought area” and is still falling, which is an additional signal in favor of further decline towards 50.0% fibo. After completing the correction, the asset may test and break 61.8% fibo, and then continue trading upwards. The upside target is similar to the daily chart, 0.6800.

Ripple started its rally on November 20th, together with other cryptocurrencies. There are a lot of explanations of why it happened, from investors’ search for alternatives to fiat instruments to a surge in interest in cryptoassets from institutional players. Indeed, all of this really took place and, of course, expansion of the interest was in favor of cryptocurrencies. The entire market is on the rise but since “trees don’t grow sky-high”, active purchases faded to the correction.
Over this period of time, XRP has managed to update its high reached in May 2018. The asset is still moving like 80% below the highs of January 2018, when it was trading at $3.7, but investors are surely positive about further growth.
At the moment, XRP is back to third place in the list of the strongest and most popular cryptoassets.
