Quick take:
- ChainLink is currently printing a rising wedge pattern on the lower time frames
- A resolution of this wedge could result in LINK dropping to the $12 support area
- If $12 fails, ChainLink could very well be on a path towards retesting $10
- However, from the daily chart, LINK is still exhibiting considerable bullishness with a retest of the $14 to $15 price area still a possibility
ChainLink is once again above $13 in a move that could open LINK to the $14 to $15 price area. However, the upward path for ChainLink might not be a clear shot as shall be explained below.
From the hourly chart, it can be observed that ChainLink is printing a rising wedge pattern. Rising wedges are usually a sign of reduced buying and could foreshadow ChainLink’s value once again dropping to the crucial support zone at $12 as illustrated in the chart below courtesy of Tradingview.
From the chart above, it can also be observed that ChainLink’s trade volume has been on a decline since the 7th of November. Such a drop in trade volume is also an indicator that LINK could be destined for a retest of $12.
The Daily LINK/USDT Chart Still Hints of Bullishness
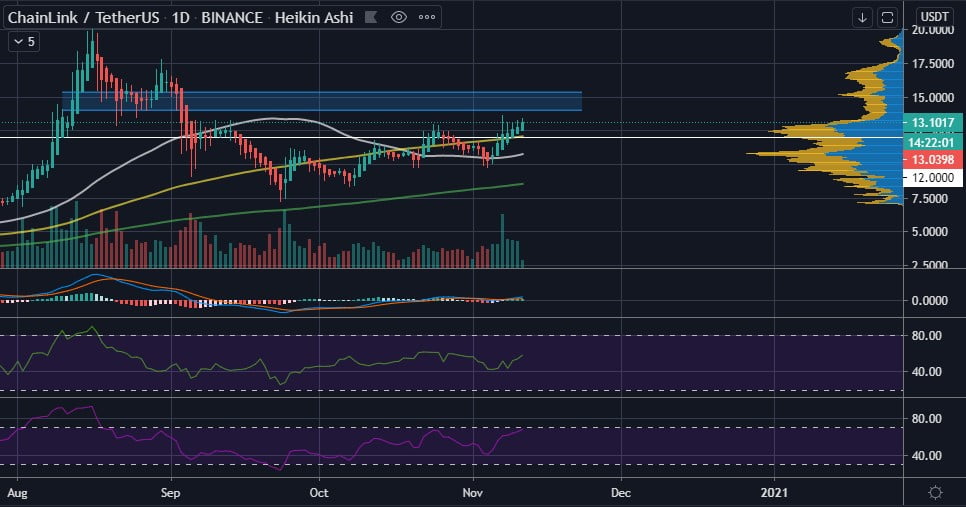
However, LINK dropping to $12 might be a momentary pullback as the daily chart is providing some hints that the $14 to $15 could be a possibility for ChainLink in the near future.

A quick analysis of the LINK/USDT daily chart above reveals the following.
- Trade volume is in the green with buying gradually reducing
- The daily MACD has crossed in a bullish manner slightly above the baseline
- The daily MFI is at 58 which is in neutral territory
- The daily RSI is at 68 and is yet to hit overbought territory
- Chainlink’s price at around $13 is above all the three moving averages: 50-day, 100-day and 200-day
- If the $12 support area fails, LINK could find substantial support at $11.70, $11.20, $10.90, $10.50 and $10
Conclusion
Summing it up, the digital asset of ChainLink (LINK) has printed a rising wedge pattern on the one hour chart. This could foreshadow a brief drop of LINK to the $12 price level. The daily LINK/USDT chart provides some hints that the drop to $12 might be temporary and could be a good area for a bounce to the $14 to $15 price range.
However, if the $12 support zone fails, ChainLink could very well be on a path towards another crucial support area at $10.
As with all analyses of ChainLink, traders and investors are advised to have an eye out for any sudden Bitcoin movements in either direction, that could affect LINK. The use of adequate stop losses and low leverage is also advised when trading LINK on the various derivatives platforms.
