Some coins have already entered a short-term correction phase to gain efforts for the continued growth. Mainly, Polkadot (DOT) is the top loser today, falling by 3% over the last day.
The vital information on Bitcoin (BTC), Ethereum (ETH), XRP, EOS, Tron (TRX), Cardano (ADA) and Chainlink (LINK):
| Name | Ticker | Market Cap | Price | Volume (24h) | Change (24h) |
| Bitcoin | BTC | $356,565,690,022 | $19,218.01 | $48,264,845,566 | 1.59% |
| Ethereum | ETH | $67,971,000,394 | $598.49 | $21,762,144,200 | -0.94% |
| XRP | XRP | $31,254,765,832 | $0.689217 | $26,701,720,840 | 11.18% |
| EOS | EOS | $3,310,642,567 | $3.53 | $4,537,243,957 | 0.87% |
| Tron | TRX | $2,593,526,674 | $0.036192 | $2,516,194,667 | 7.78% |
| Cardano | ADA | $5,368,477,924 | $0.172551 | $1,899,679,089 | 6.46% |
| Chainlink | LINK | $6,069,431,951 | $15.42 | $1,855,130,132 | -0.10% |
BTC/USD
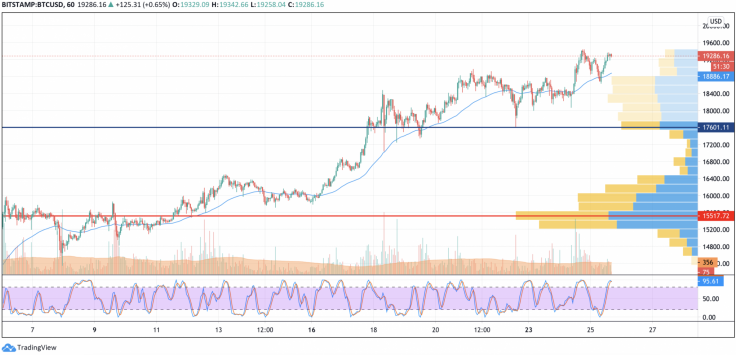
Yesterday, in the morning, buyers increased their buying volumes, and the price of Bitcoin (BTC) quickly recovered from the average price area to the resistance of $18,800. The bulls have finally managed to pass the zone of the annual high, set last weekend, and to update the annual record to $19,416.
BTC/USD chart by TradingView
In the evening, the trading volumes began to decline and the pair could not hold above the $19,000 mark. As of this morning, the price of BTC has rolled back to the hourly moving average EMA55, which passes in the area of $18,800.
Sales volumes are small, and if the bulls can continue to rally in this area, then today a retest of the 100% fibo level ($19,666) is possible.
Bitcoin is trading at $19,226 at press time.
ETH/USD
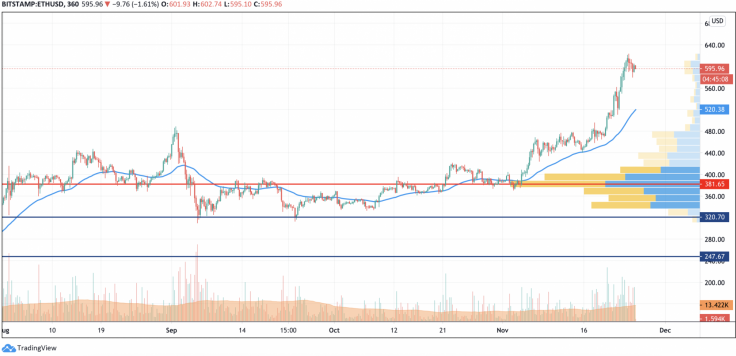
After a retest of the $620 level, the Ethereum (ETH) price set a new annual high around the $624 mark and turned into a pullback.
ETH/USD chart by TradingView
The psychological level of $600 could not stop the decline. The bears pushed through this level but, as of this morning, the trading volumes have decreased, and the price is stuck in the area of more reliable support of $580. If the bears intensify the onslaught, then the decline may continue to the level of $550.
Ethereum is trading at $596.26 at press time.
XRP/USD
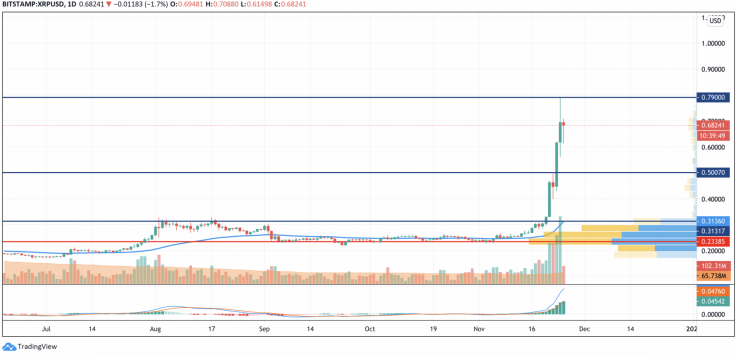
Yesterday morning, the bulls continued to drag the XRP price into the area of a new high and recorded an annual record at around $0.79.
XRP/USD chart by TradingView
The bears responded with large sales and reversed the price. At some point, they managed to pierce the support of $0.60, but until this morning the pair managed to gain a foothold above this mark. If the bulls resume active action, they may try to return the pair to the zone of the annual high and test the $0.80 mark.
XRP is trading at $0.6835 at press time.
EOS/USD
The rate of EOS is almost unchanged since yesterday. The price of the altcoin has increased by only 0.87%.
EOS/USD chart by TradingView
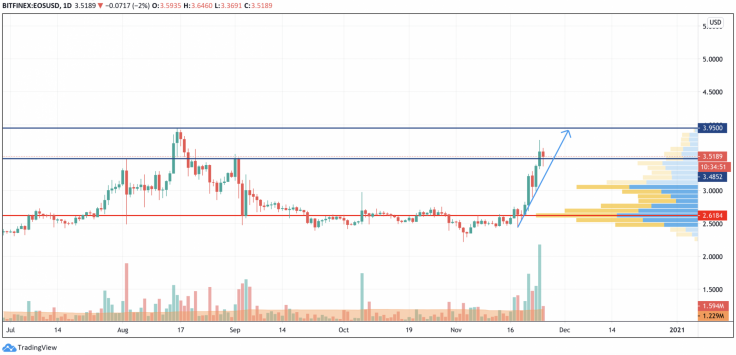
According to the daily chart, EOS is about to retest the peak of 2020 at $3.95. As it is the far resistance level, there are low chances of breaking it from the first time. In this case, the more likely scenario is a consolidation for a few days in the range of $3.4852-$3.95 before the breakout happens.
EOS is trading at $3.53 at press time.
TRX/USD
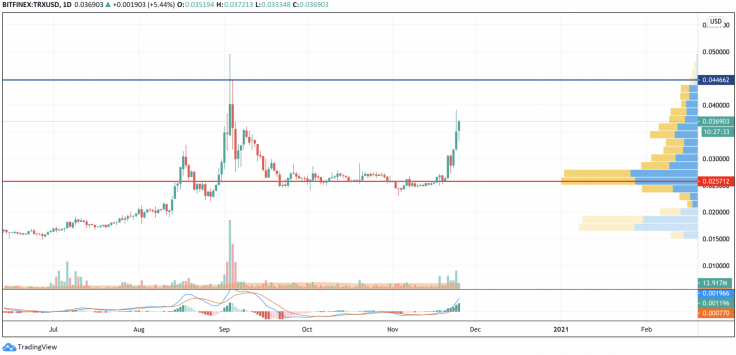
Tron (TRX) is the second fastest growing coin today. Its rate has rocketed by 11% over the last 24 hours.
TRX/USD chart by TradingView
Tron (TRX) is trading similarly to EOS and the ongoing rise has not reached its peak yet. The MACD indicator confirms the current growth as there are no reasons for a correction so far. The buying volume is also high, which means that a short-term decline may occur when bulls get to the resistance of $0.044.
TRX is trading at $0.0369 at press time.
ADA/USD
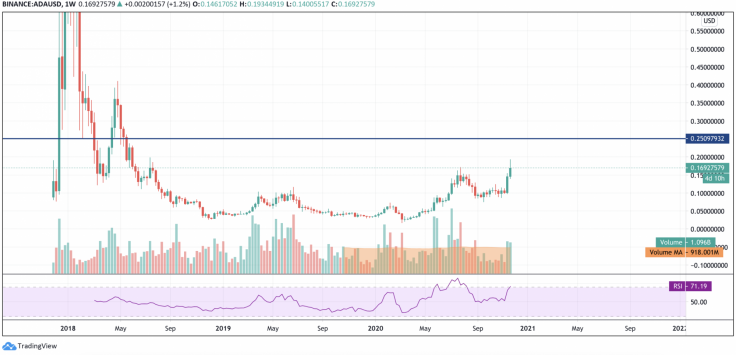
Cardano (ADA) is also trading in the green zone. The price change over the last week has made up +62.09%.
ADA/USD chart by TradingView
On the weekly chart, Cardano (ADA) has started its growth after being in the accumulation zone for a few weeks. The value of the RSI indicator has not reached the overbought area yet, which means that bulls can get to the closest resistance at $0.25 before a more profound decline starts.
Cardano is trading at $0.1690 at press time.
LINK/USD
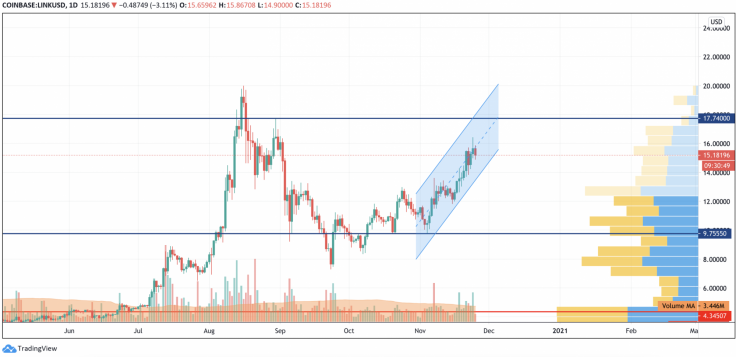
Even though the long-term trend of Chainlink (LINK) is bullish, its rate has declined over the last day.
LINK/USD chart by TradingView
On the daily chart, Chainlink (LINK) has been trading within the rising channel since the beginning of this month. Its price has not surpassed the peak reached in August of this year, which means the rising potential remains. That is why the first stop at which bears may seize the short-term initiative is $17.74.
Chainlink is trading at $15.23 at press time.

