Bitcoin cash isn’t the only crypto feeling the brunt of bitcoin’s volatility. Bitcoin’s return has surged the highest since August, accompanying this high return is the volatility, which has also seen a stark surge.
The above table shows bitcoin volatility which has affected all altcoins’ returns and price movement. The highest volatility is being seen as of this writing, with only 18 months of November passing by. An interesting observation here is the returns that bitcoin has offered in this time frame.
As for bitcoin cash, the returns since November 1 is at -4.76%.

Source: Coinmetrics
What’s more important here is that the correlation of altcoins, in general, has risen as well. We can see this is the case, at least since November 6, from which point onwards, the correlation started increasing and is still on the rise. The highest so far is for bitcoin and litecoin with bitcoin cash at 0.55.
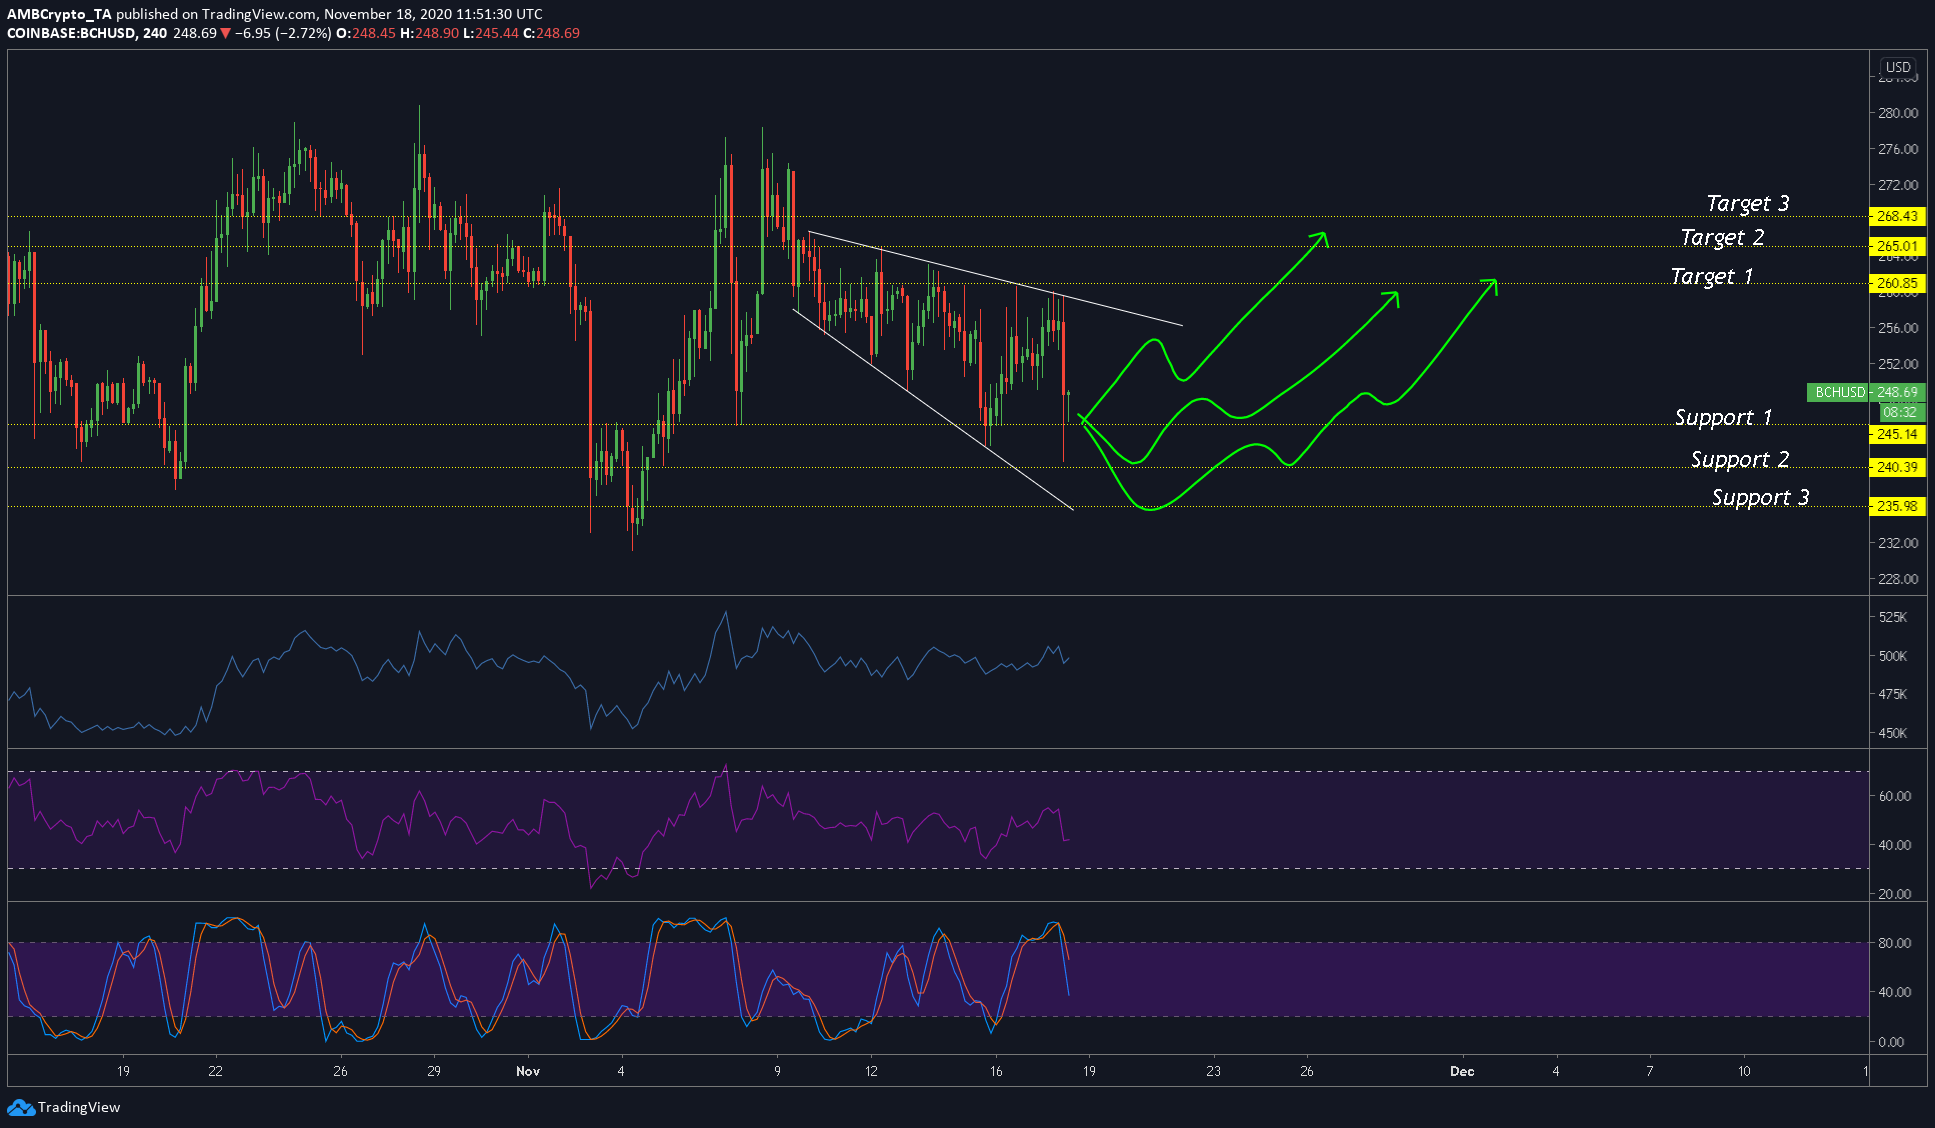
Bitcoin Cash 4-hour chart

Source: BCHUSD TradingView
The 4-hour chart for bitcoin cash showed a bullish prospect for the coin despite the volatility. Perhaps, if the price does break higher as shown, the monthly returns will flip from being negative to positive. Bitcoin cash has formed a descending broadening wedge, which suggests a breakout to the north.
Rationale
The rationale for this bullishness is the pattern, additionally, we have the stable volume as indicated by the OBV indicator, which suggested that despite the price drop, the volume has managed to stay strong.
However, both RSI and Stochastic RSI indicate that BCH is in the overbought zone and will head lower. This indication will be important as it might push the coin lower.
Conclusion
If so, then the support lines [shown in the above chart] will come into action; the support lines will prevent BCH from heading lower. Since the 1st two lines were already tested [wick down], we might expect the second support to hold the price.
The price might even start a bounce from the second support, hence, an over long would be a good position.
