Bitcoin Cash has been preparing for a hard fork which may result in the formation of a new token. However, unlike Bitcoin, the BCH market had been moving downwards.
This was something visible across most alts, as BTC value grew stronger, the same was not mirrored by the alts, as most of them remained under bearish pressure, at press time.
Bitcoin Cash [BCH]
Source: BCH/USD on TradingView
Bitcoin Cash’s price hit the resistance at $278.05 and collapsed from there. It was trading at $254.253, but the volatile nature of the market could cause another swing in the price of the asset. The current range has not been supported by a strong price level. As the immediate support remained low at $213.614.
The Bollinger Bands remained at a distance noting the volatility in the market, whereas the signal line remained above the price bars. This position of the signal line suggested the price has been trending lower and has not been able to show signs of reversal.
Dash

Source: DASH/USD on TradingView
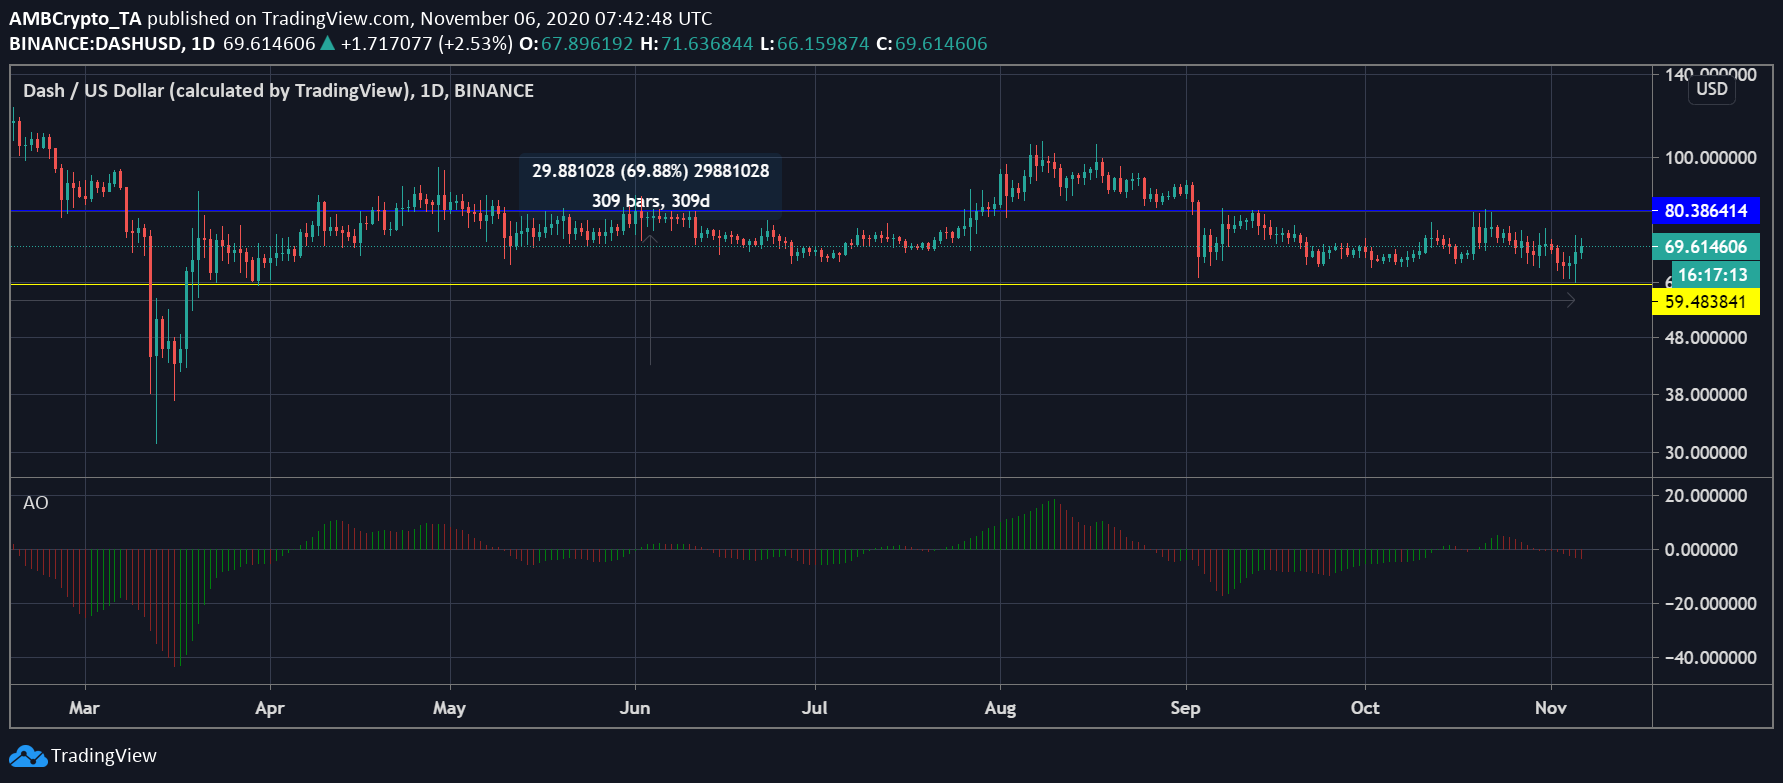
Dash has been one of the prominent altcoins and has been noting reversal in the price trend as the coin surged by 19.30% in the past one day. The value of Dash touched the low at $66 before boosting and was currently being traded at $69.36. However, this reversal has not been supported by volume and thus, the formation of wicks as the price tapered between $71.63 and $60.04.
The Awesome Oscillator indicator remained in the negative range of -3.26. This was the indicator of the selling pressure in the market and the low momentum in the market.
FTX Token [FTT]

Source: FTT/USD on TradingView
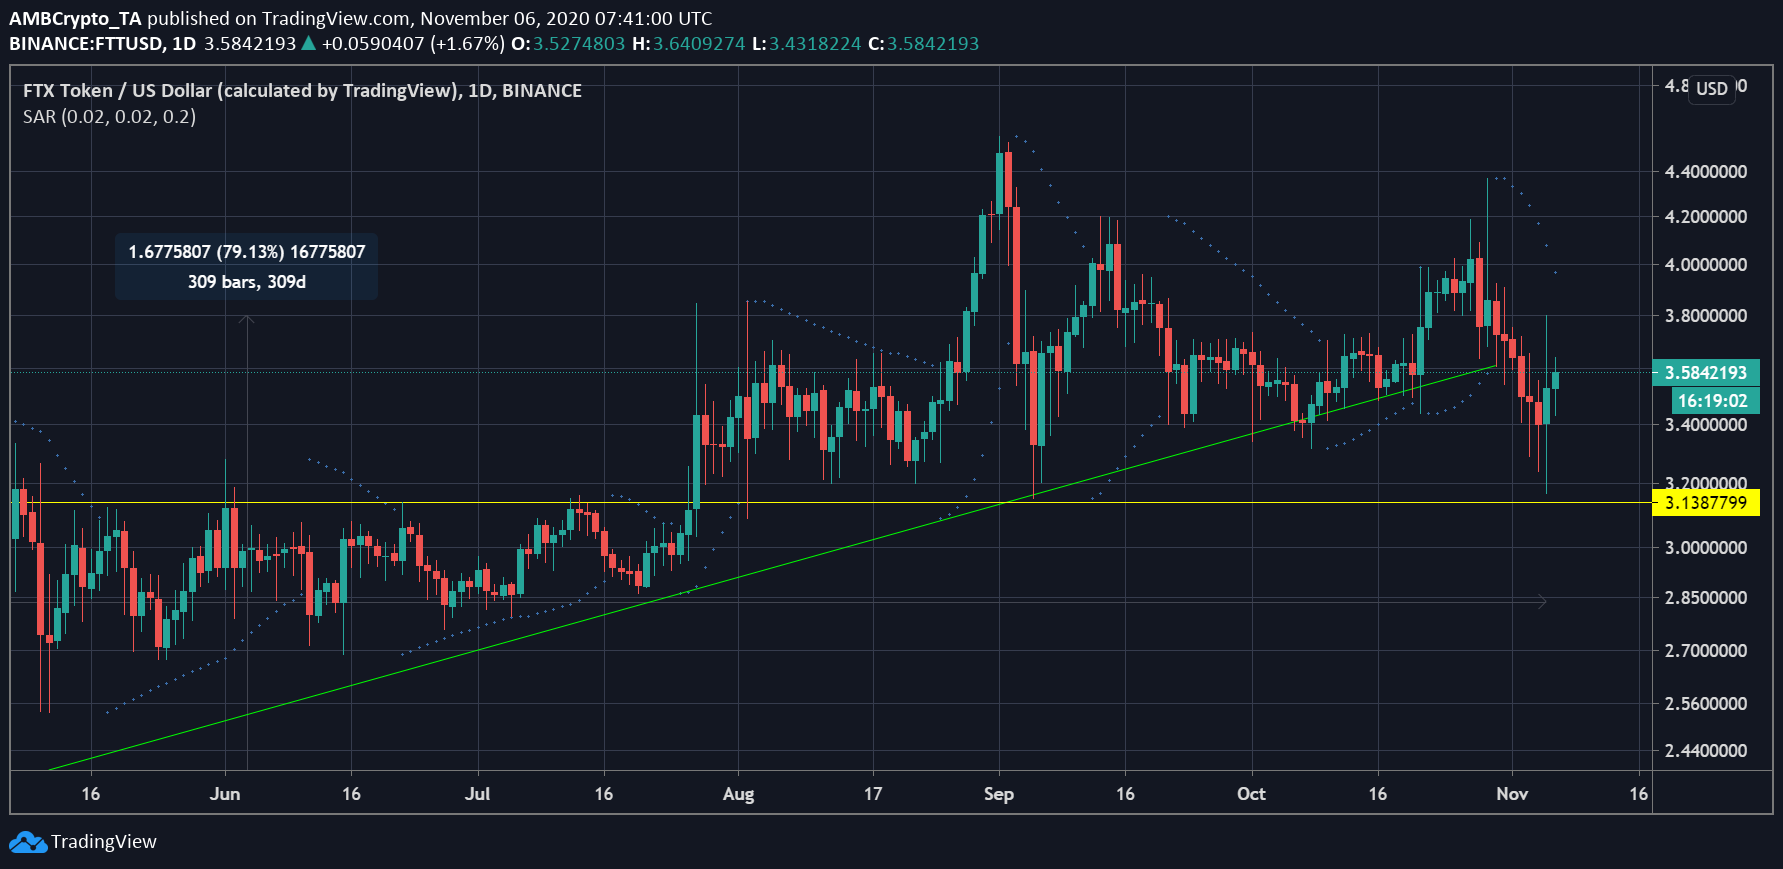
The FTX token has been one of the popular tokens among users and its upwards trend since the crash has managed to return 79% to investors year-to-date. Although, a few days back, the FTT token broke out of this extended slope marking higher lows. The value of the digital asset dropped by 27% in a week and noted a low at $3.16.
The coin has bounced higher from this point and was being traded at $3.58. The bounce-back has not managed to set a trend reversal and the existing trend remained bearish. The Parabolic SAR noted the markers aligning above the candlesticks noting the looming selling pressure.
