Bitcoin (BTC/USD) and Ripple (XRP/USD) Price, Analysis and Chart:
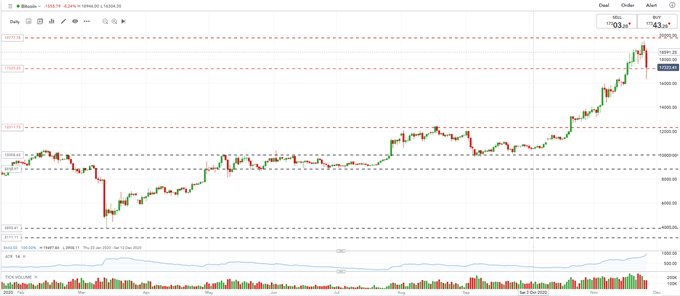
The cryptocurrency market hit heavy selling pressure over the last 24 hours, sending the market spiraling lower. Market leader Bitcoin (BTC) dropped from a high point of just under $19,500 to around $16,300, giving back 10 days’ worth of gains in one day. BTC was just a couple of hundred dollars shy of making a fresh all-time high and the sell-off was not led by any market-moving news or event. Despite this sharp move lower, market expectations are that Bitcoin will soon make a new ATH and that today’s flush out offers buyers a chance of entering the market at a better level. Whether this is the case or not, Bitcoin’s volatility has jumped over the last few days to multi-month highs and further wild price swings cannot be discounted.

Recommended by Nick Cawley
Get Your Free Introduction To Bitcoin Trading
Bitcoin (BTC/USD) Daily Price Chart (March – November 26, 2020)
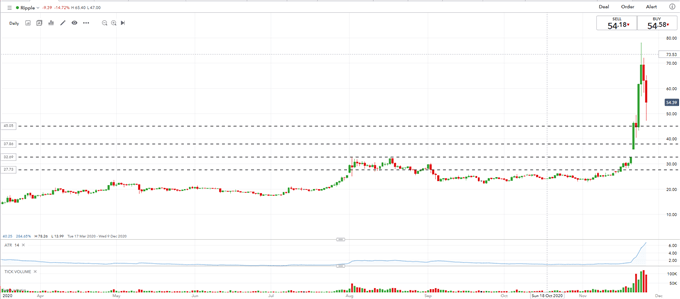
After doing nothing for months, Ripple took off at the end of last week, rallying from around $0.30 to a $0.78 peak on Tuesday in heavy turnover. IG client sentiment has highlighted for months that retail has been heavily long of XRP and recent turnover shows that retail has returned to the market in heavy numbers. While Ripple has given back a large portion of its recent gains, it remains around 70% higher than last Friday, and if it can consolidate these gains, a push back to Tuesday’s high may be on the cards.
| Change in | Longs | Shorts | OI |
| Daily | -5% | 5% | -5% |
| Weekly | 43% | 148% | 47% |
Ripple (XRPUSD) Daily Price Chart (March – November 26, 2020)
Traders of all levels and abilities will find something to help them make more informed decisions in the new and improved DailyFX Trading Education Centre
What is your view on Bitcoin (BTC) and Ripple (XRP) – bullish or bearish?? You can let us know via the form at the end of this piece or you can contact the author via Twitter @nickcawley1.


