- Bitcoin price has been dominating the market for the past two weeks while many altcoins have suffered significant losses.
- The total altcoin market capitalization has jumped by $8 billion in the past 24 hours.
Despite the current price action of Bitcoin, some indicators show the flagship cryptocurrency might be either slowing down or losing some ground to altcoins. Bitcoin touched $16,800 one hour ago but it seems that its market dominance is not rising anymore.
Bitcoin dominance faces a strong barrier ahead
The TD Sequential indicator has presented a sell signal on the Bitcoin dominance chart. BTC also seems to be bounded inside a broadening wedge on the weekly chart and has just touched the upper boundary.
Bitcoin dominance weekly chart
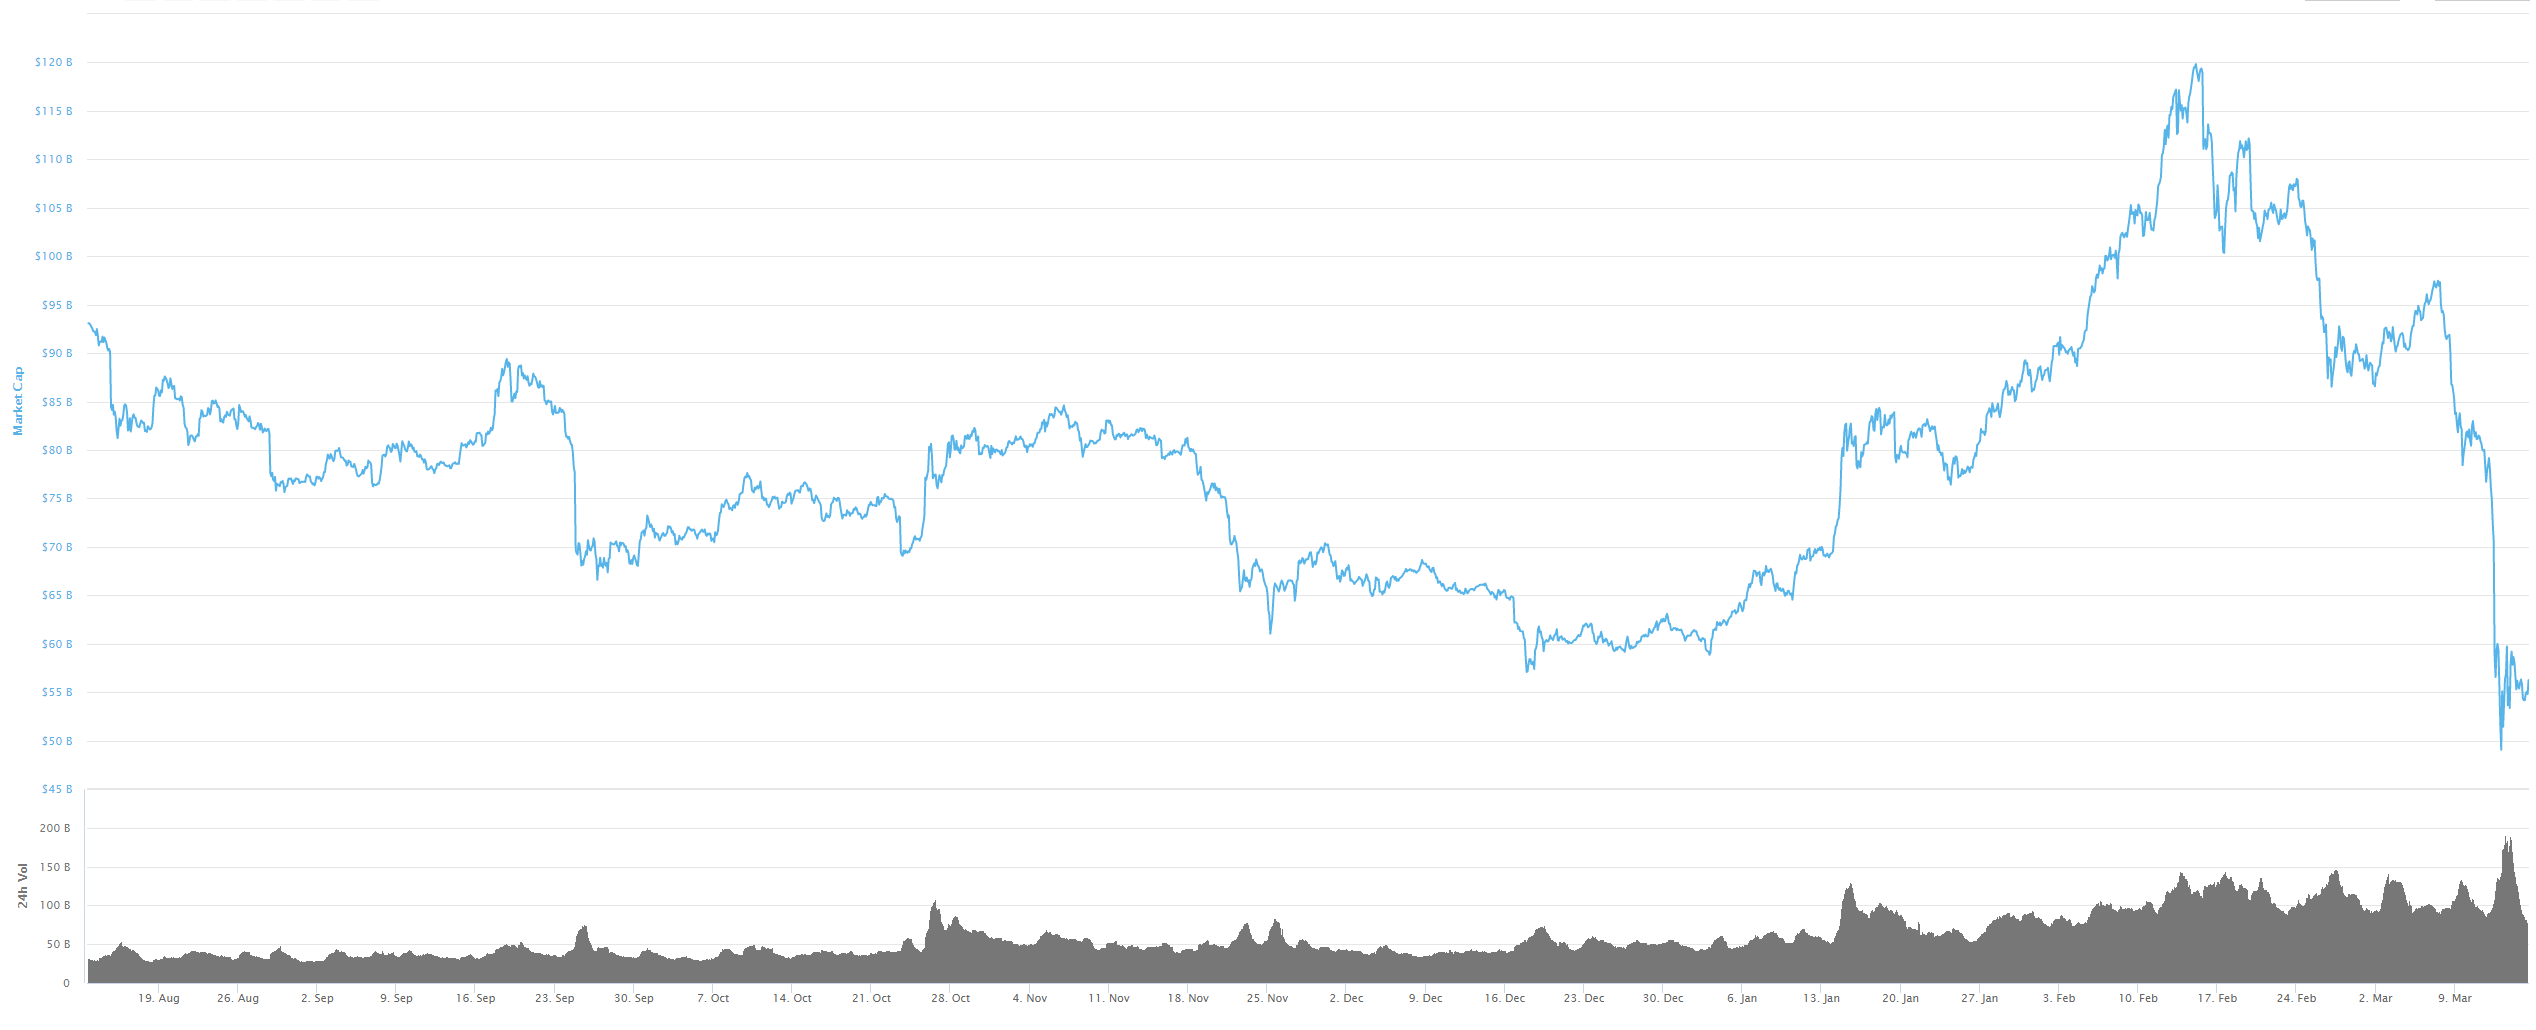
It’s important to note that Bitcoin losing dominance doesn’t necessarily mean its price will decline. On September 2, 2019, BTC hit 73% and dropped to 61% five months later. In the same time frame, the altcoin market capitalization exploded from $76 billion to a peak of $117 billion.
Altcoin market capitalization chart
This clearly shows an inverse correlation between the market dominance of Bitcoin and altcoins rising. Another steep correction on the weekly chart of Bitcoin could lead to altcoins gaining momentum again. Validation of the sell signal provided by the TD Sequential can potentially drive Bitcoin’s dominance towards 55% in the long-term.
The current altcoin market capitalization is at $82 billion, a number that pales in comparison with the all-time high by the end of 2017 at $530 billion. The next target seems to be $282 billion, seen in May 2018. Trading volume is increasing again for the altcoin market. Validation of the sell signal on Bitcoin’s dominance chart can quickly drive the altcoin market towards the high of $282 billion.

