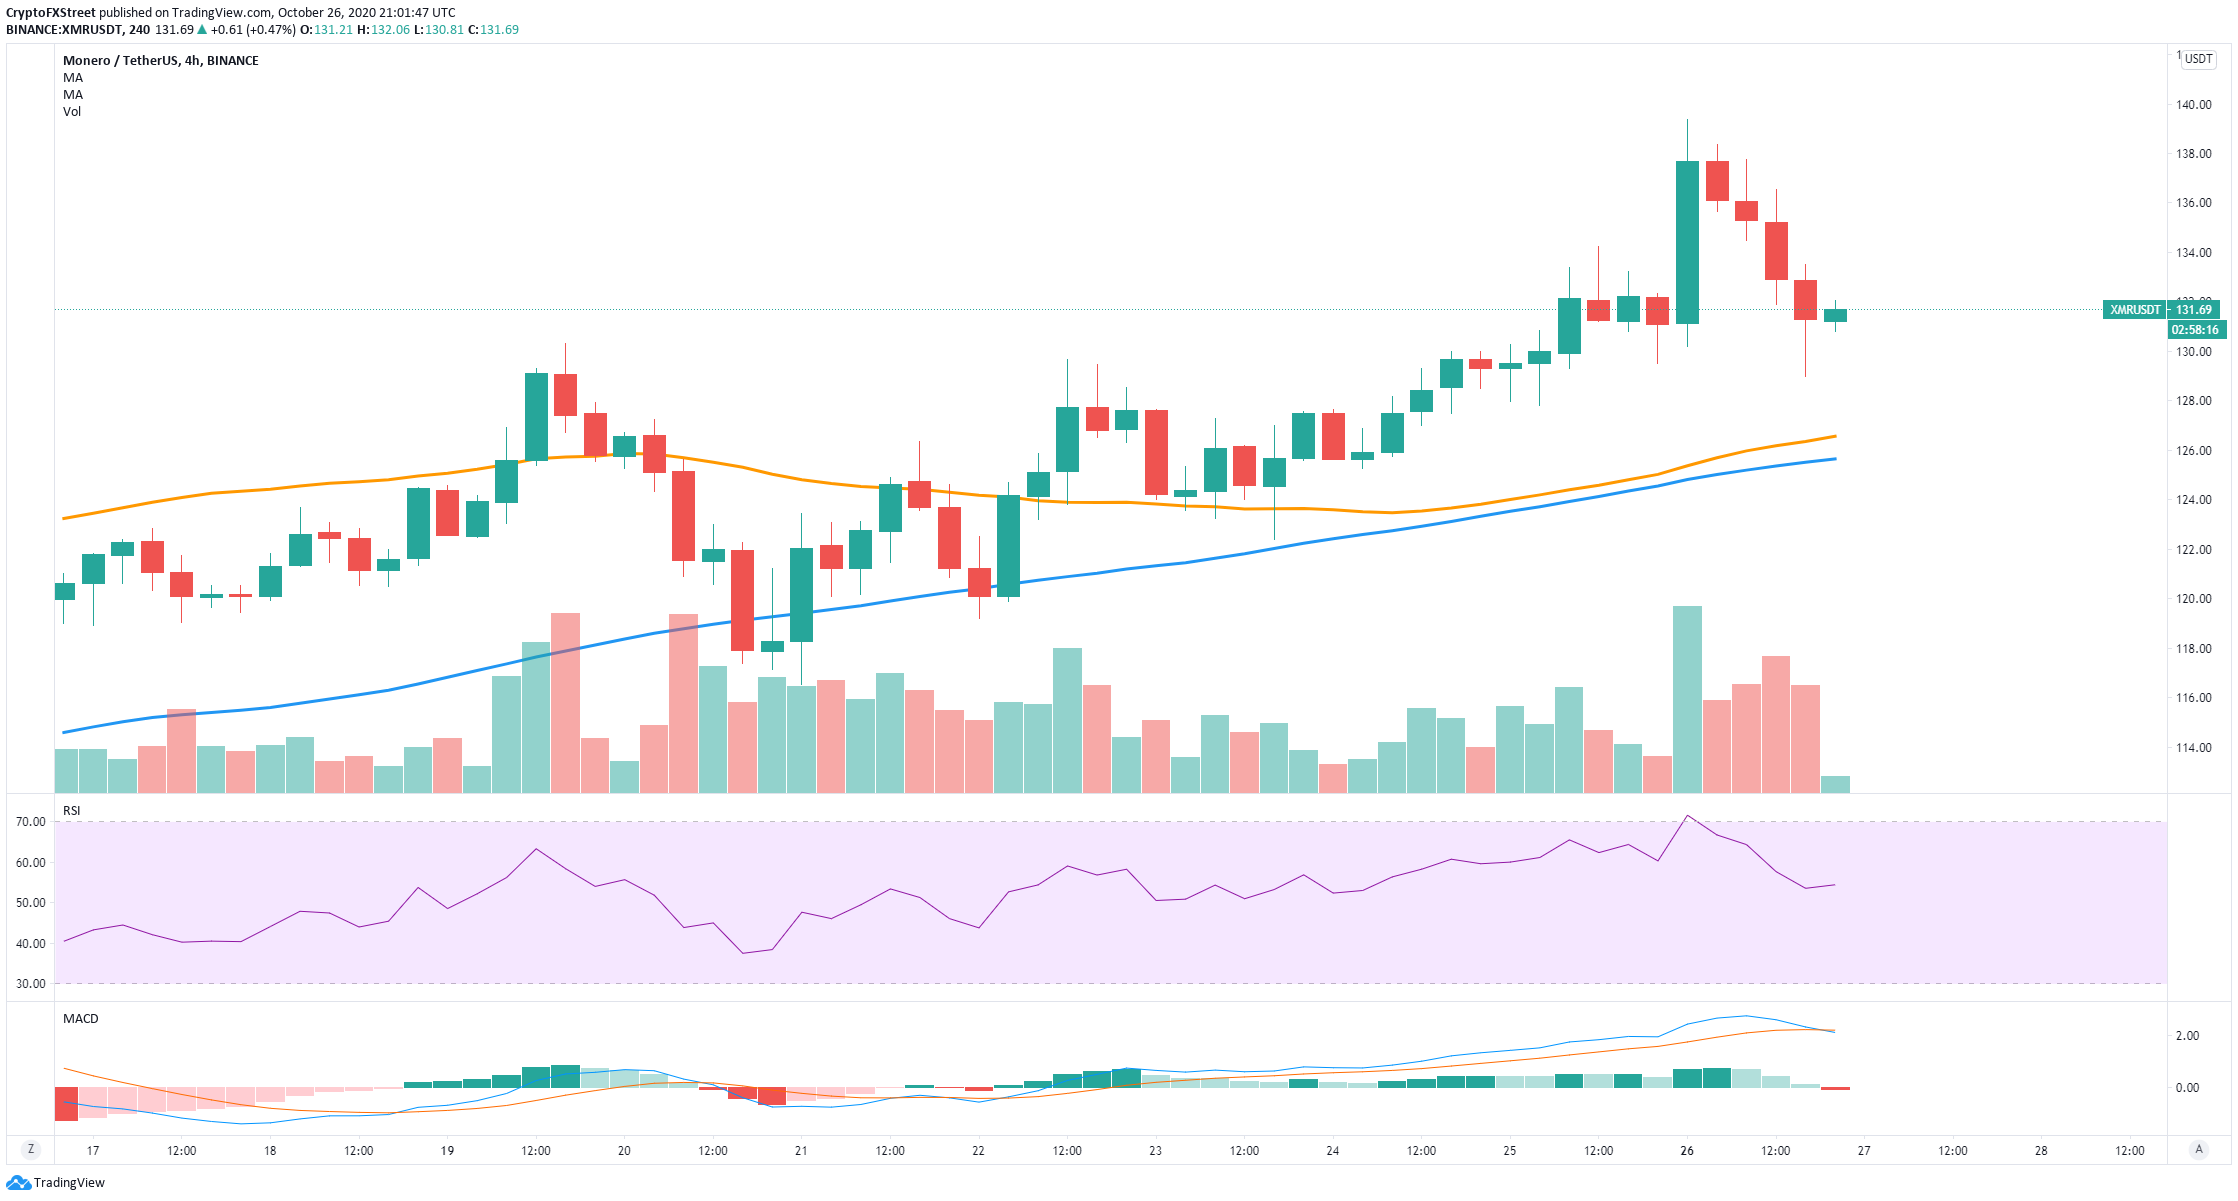
- XMR is trading at $131.54 after hitting a robust resistance level at $139.
- On the 12-hour chart, the price seems to have established a double top.
XMR is up by 13% in the past five days and has confirmed uptrends on the daily chart and the 12-hour chart. Monero is currently ranked 14th by market capitalization, with $2.32 billion.
Monero facing a potential rejection towards $100
On the 12-hour chart, the price of XMR got rejected at $139, forming what seems to be a double top currently. On top of that, the TD sequential indicator presented a sell signal, which also happened on October 12, the other head of the double top.
XMR/USDT 12-hour chart
Validation and continuation of this sell signal can easily drive the price of XMR down to the 50-SMA at $120 and as low as $100. The MACD is slowly turning bearish, and selling pressure is mounting on XMR.
XMR bulls still holding short-term time frames
The 4-hour chart is still in favor of the bulls as the uptrend continues intact. The 50-SMA and the 100-SMA are acting as healthy support levels at around $125. The RSI was overextended for a brief period of time but has cooled off significantly.
XMR/USDT 4-hour chart
The most critical resistance level is $139, where the double top seems to be formed. A breakout above this point would be crucial and likely to push the price of XMR towards $300 as there is very little resistance to the upside.

