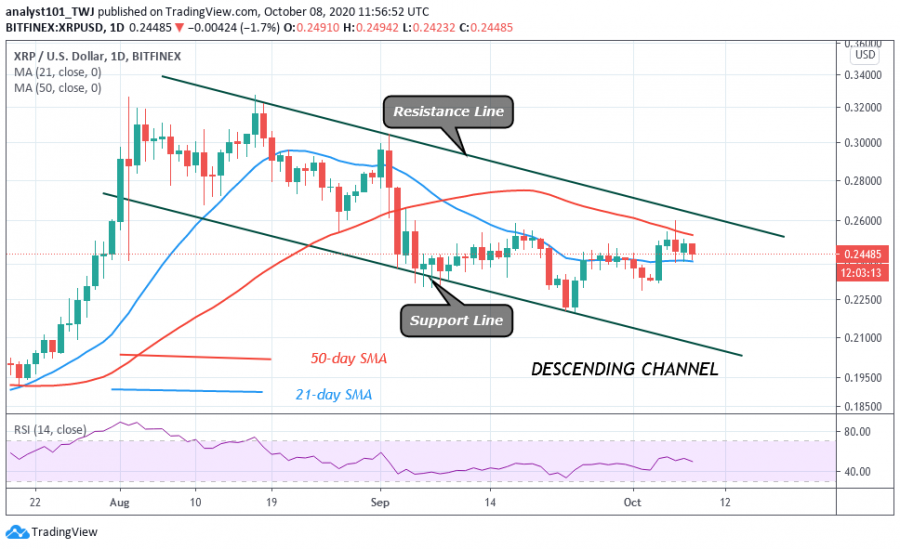
The recent rally to $0.26 high has been invalidated has buyers failed to sustain the current uptrend. Sellers were overwhelming as the price was pushed to the $0.24 low.
The current downtrend is likely to surpass the previous one as the coin retests the $0.25 resistance. After the retest at $0.25, prices resumed the downtrend on the downside. Nonetheless, the price action is indicating bullish signals as price found support above $0.242 support.
The crypto is likely to resume uptrend above the current support if it holds. Nevertheless, if the bears break below the $0.24 support, the price will drop to $0.23 low and extend to $0.22 support. Meanwhile, buyers have regained the current support as price approaches the $0.25 high. There is a possibility that if buyers push the price above $0.26, a rally above $0.30 is likely.
Ripple indicator analysis
The downward move resulted in price finding support above the 21-day SMA. The 50-day SMA support has propelled prices to rise. The coin will resume full bullish momentum if it breaks above SMAs. The SMAs are sloping upward indicating the previous uptrend.

Key Resistance Zones: $0.35, $0.40, $0.45
Key Support Zones: $0.25, $0.20, $0.15
What is the next move for Ripple?
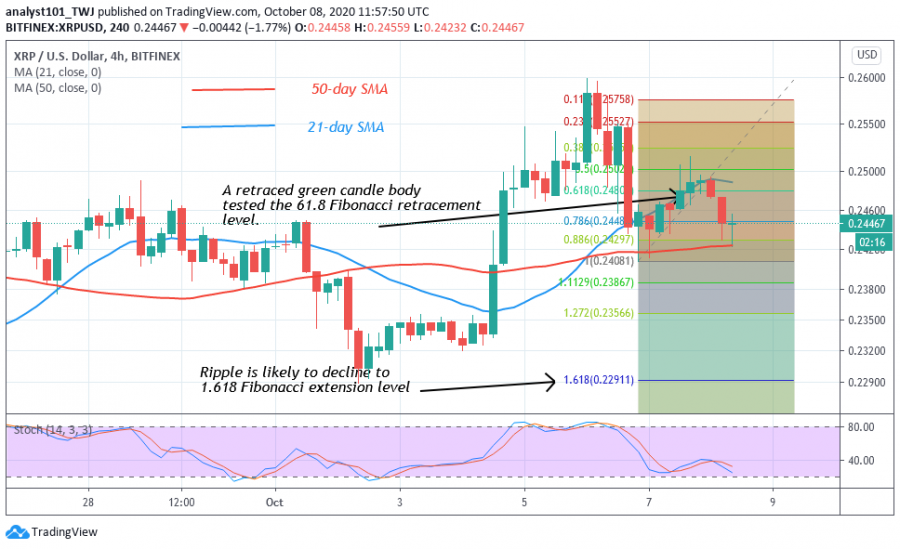
According to the price action on October 6, XRP may risk further decline. On October 6 downtrend, the coin dropped to $0.243 low, while the retraced candle body tested the 61.8% Fibonacci retracement level. The implication is that XRP will fall to level 1.618 Fibonacci extension or the low of $0.229.

Disclaimer. This analysis and forecast are the personal opinions of the author that are not a recommendation to buy or sell cryptocurrency and should not be viewed as an endorsement by CoinIdol. Readers should do their own research before investing funds.
